Viewing your portfolio as a bar chart
You use the Portfolio Overview page to view your Asta Vision projects and programmes in the form of a Gantt chart - a bar chart that illustrates a project, or projects, graphically.
To access the Portfolio Overview page from the Asta Vision Home page, click Projects, then click  .
.
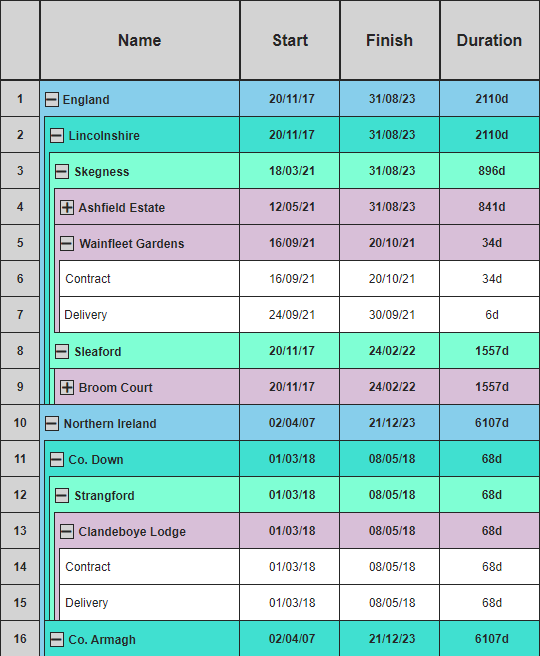
The bar chart displays each project and programme on its own row, with a spreadsheet displaying project and programme information. The spreadsheet displays the name, start and finish date and duration of each project and programme, plus the same columns that are displayed on the Projects page.
Projects are displayed like this:  ; programmes are displayed like this:
  . The colour of each project and programme indicates its current status:
-
 - 'Checked out'.
 -
 - 'Submitted' or 'Awaiting Approval'.
 -
 - All other statuses.
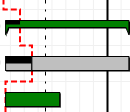
A red, dotted progress line, with the report date set to the current date, appears in the bar chart. The distributed percentage complete of each programme is displayed as a black progress bar; progress is displayed on each project as the average of the progress dates for each of the project's programmes:

If a project-level user-defined field has been selected in the Project Hierarchy UDF field, on the Project Hierarchy page, a summary task is displayed in the bar chart for each value in the selected user-defined field, and projects are grouped according to what has been selected in the user-defined field for each project. For example, if you select a user-defined field that is used to specify the geographical location of each project, a summary task is displayed for each location and the projects that take place in that location are grouped beneath the summary task:

If the user-defined field that is being used to group the projects is linked to a hierarchical user-defined enumeration, you can expand and contract it in the same way you expand and contract the project and programme hierarchy. If the field is linked to a standard user-defined enumeration, there will be only one level to the hierarchy.
Depending on your access rights, you may not be able to carry out all of the actions described below.
To filter the projects and programmes that appear in the bar chart:
- Click Projects above the list and specify a project status - Default, Archived or Pending Delete. If you do this, only projects of the specified status are displayed.
The Projects field appears only if you have permission to delete projects. - Click one of the other project grid filters above the list. Filters based on enumeration-type fields display a drop-down menu; those based on user-type fields display a popup. Select an item to display only projects that match your selection.
You can configure which project grid filters are available. For example, you may be able to filter for projects that take place in a particular region, or for projects that have a specific Lead Planner. - Click Filter For Assigned User and select a user from the popup that appears. If you do this, only projects to which the selected user is assigned are displayed.
- Click Programme Types and specify a particular type of programme. If you do this, only programmes of the specified type are displayed and no projects are displayed; select 'Clear Filter' in this drop-down to display projects and programmes of all types.
- Click Status and specify a particular programme status. If you do this, only programmes of the specified status are displayed; select 'Clear Filter' in this drop-down to display programmes of all statuses.
To create a project, click Create Project.
To edit a project or programme, click the project or programme's bar in the bar chart. The Project page opens in a new browser tab, displaying details of the project or programme.
You can expand projects to view their programmes in the bar chart, and contract projects to hide their programmes:
- To expand a project, click
 to the left of the project name in the 'Name' column of the spreadsheet. The project's programmes are displayed beneath the project:
- To contract a project, click
 to the left of the project name in the 'Name' column of the spreadsheet. The project's programmes are hidden from view and + symbols appear to the left and right of the project in the spreadsheet:
You can move backwards and forwards in time - viewing projects and portfolios earlier or later than those that are currently displayed - by clicking and dragging the date zone at the top of the bar chart to the left and right:

You can also use the horizontal scroll bar at the bottom of the bar chart to move forwards and backwards in time.
You can display a whole single month or a whole single year in the bar chart, starting at the date that appears at the far left of the date zone:
- To display a whole single month, click the Scale dropdown at the top right of the bar chart and select Month.
- To display a whole single year, click the Scale dropdown at the top right of the bar chart and select Year.
You can zoom into the bar chart to view dates in greater detail, and zoom out to view dates in less detail:
- To zoom into the bar chart, click
 at the top right of the bar chart. Dates are displayed in greater detail and the bar chart covers a smaller period of time.
 - To zoom out of the bar chart, click
 at the top right of the bar chart. Dates are displayed in less detail and the bar chart covers a larger period of time.
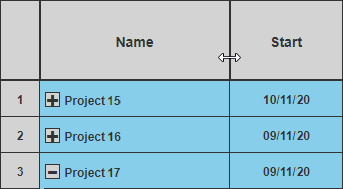
To change the width of a column in the spreadsheet:
- Position the mouse pointer over the right-hand edge of the column header so that the cursor looks like this
 :
:
- Click and drag the edge of the column header to the left to reduce the width of the column, or to the right to increase its width, then release the mouse button.
To change the position of a column in the spreadsheet:
- Position the mouse pointer over the centre of the header of the column.
- Click and drag the column header to the left or right to change the position of the column. As you move the column header, a red line appears in the column headers to indicate where the column will be moved to when you release the mouse button. In the illustration below, the 'Status' column will be moved to a position between the 'Finish' and 'Duration' columns:

- Release the mouse button to move the column to the indicated position.
You can resize the bar chart by clicking and dragging its left border to the left or right. Moving the border to the left increases the size of the bar chart and obscures the right-most columns of the spreadsheet; moving the border to the right decreases the size of the bar chart and may make more columns of the spreadsheet visible.
To resize the bar chart:
- Position the mouse pointer over the line that divides the spreadsheet from the bar chart so that the cursor looks like this
 .
. - Click and drag the left edge of the bar chart to the left to increase the size of the bar chart, or to the right to decrease its size, then release the mouse button:

To view your portfolio of projects as a list, click  .
.
Working with projects and programmes
Creating projects and programmes
Editing projects and programmes
Viewing a programme as a bar chart
Configuring how projects are grouped on the Projects and Portfolio Overview pages