Viewing a programme as a bar chart
You use the Project View page to view your Asta Vision programmes in the form of a Gantt chart - a bar chart that illustrates a project, or projects, graphically.
To display a bar chart view of a programme from the Asta Vision Home page:
- Click Projects. The Projects page appears.
- Click the name of the project you want to view. The Project page appears
- Click View, then click the name of the programme in which you are interested.
The bar chart displays each task on its own row, with a spreadsheet displaying - by default - the name, start and finish date and duration of each task. If a bar contains more than one task in Asta Powerproject, that bar's tasks are displayed on the same row in the Asta Vision bar chart. The programme hierarchy is colour-coded to indicate the different hierarchy levels. A red, dotted progress line appears in the bar chart, representing the report date of the latest progress period in the programme. The duration percentage complete of each task is displayed as a black progress bar:
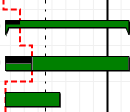
Non-working time is folded out of view, according to the programme's default calendar.
You can expand and contract the hierarchy to view different elements of the programme:
- Click
 to expand a level of the hierarchy and view its contents:
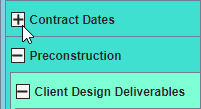
- Click
 to contract a level of the hierarchy and hide its contents:
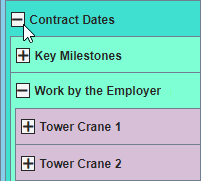
The entire programme hierarchy of charts and summary groups is displayed by default. To view a particular chart or summary group within the programme on its own, click Select Chart at the top left of the page and select the chart or summary group you want to view from the expandable programme hierarchy:
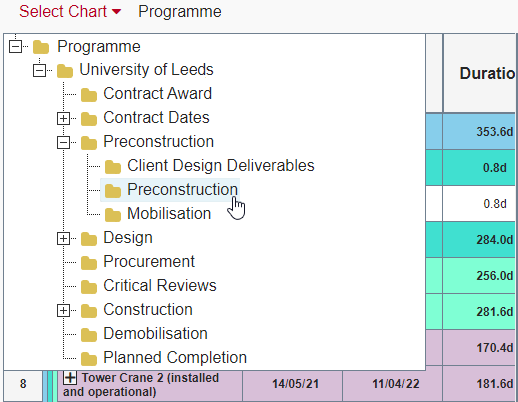
To view the entire programme hierarchy again, click Select Chart and select the top level chart - in this instance, 'Programme'.
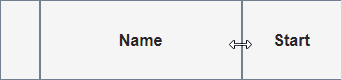
You can change the width of the bar chart, so that it takes up a greater or lesser proportion of the screen. You might want to increase the bar chart width - at the expense of the spreadsheet - to view more detail of tasks, or decrease its width to view more of the spreadsheet columns.
To change the width of the bar chart:
- Position the mouse pointer over the left-hand edge of the bar chart. The mouse pointer changes to
 :
:
- Click and drag the mouse pointer to the left to increase the width of the bar chart at the expense of the spreadsheet, or click and drag the mouse pointer to the right to decrease its width and view more of the spreadsheet columns.
For programmes that have at least one baseline, you can choose to view information from the current baseline in the bar chart. You do this by selecting the Show Baseline check box, just beneath the programme selector.
If you select this check box - which appears only for programmes that have at least one baseline - baseline tasks appear immediately beneath the corresponding tasks in the bar chart.
Clear the Show Baseline check box to omit baseline information from the bar chart.
You can change the horizontal scale of the bar chart at any time. You might want to increase the horizontal scale to display more detail and see which tasks are carried out on particular days, or decrease the scale to see an overview.
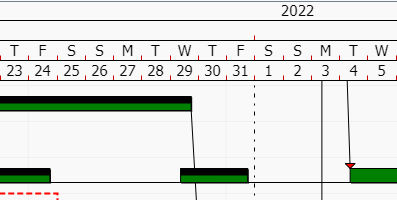
In the following illustration, the date zone scale has been increased to display more detail:
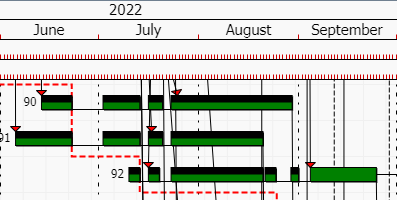
In the following illustration, the date zone scale has been decreased to display less detail:
To change the horizontal scale of the bar chart:
- Position the mouse pointer over the date zone, which appears at the top of the bar chart.
- Click and drag the mouse pointer to the right to increase the horizontal scale, displaying more detail, or click and drag the mouse pointer to the left to decrease the horizontal scale, displaying less detail.
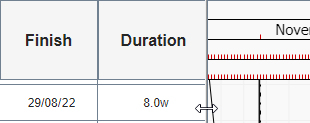
You can change the width of each column in the spreadsheet. You way want to increase the width of a column to make it easier to read the text within it, or decrease the width of columns to allow more space on the screen for the bar chart.
To change the width of a spreadsheet column:
- Position the mouse pointer over the right-hand border of the header of the column that you want to change. The mouse pointer changes to :
- Click and drag the mouse pointer to the right to increase the width of the column, or click and drag the mouse pointer to the left to decrease the width of the column.
You can add columns to the spreadsheet, remove columns from the spreadsheet and change the information that is displayed in existing spreadsheet columns.
To add a column to the right of an existing spreadsheet column, right-click the header of the existing column and select Add column - <field name> from the menu that appears, where <field name> is the name of the field that you want to display in the new column.
A new column appears to the right of the existing column. If you add a column to the right of the right-most column in the spreadsheet, you may need to decrease the width of the bar chart to see it.
To remove a column from the spreadsheet, right-click the header of the column and select Remove column from the menu that appears.
To change the information that is displayed in an existing spreadsheet column, right-click the header of the column and select Fields - <field name> from the menu that appears, where <field name> is the name of the field that you want to display in the column, in place of the existing field.
Note that if you display the 'Percent Complete' field in a column, this displays the overall percentage complete of tasks.
To view a different programme as a bar chart, click the drop-down programme selector at the top-right of the page and select the programme you want to view. The bar chart is updated to display details of the selected programme.
The Asta Vision bar chart is simpler than the Asta Powerproject bar chart. Note the following differences:
| Feature | Asta Vision bar chart | Asta Powerproject bar chart |
|---|---|---|
| Baselines | Can display information from the current baseline | Displayed |
| Allocation bars | Not displayed | Displayed |
| Code library colouring | Not displayed | Displayed |
| Non-working shading | Not displayed | Displayed |
| Shading between two dates | Not displayed | Displayed |
| Calendar folding | Not supported | Supported |
| Multiple progress lines | Not displayed | Displayed |
| Hierarchical banding colours | Fixed hierarchical banding colours; applied to summary tasks only | Configurable hieararchical banding colours; applied to summary tasks and expanded tasks |
| Expanded tasks | Displayed, but you cannot double-click them to display their subcharts; you can display subcharts by selecting them in the Select Chart control | Displayed; you can double-click them to display their subcharts |
Click Back to Details to return to the Project page when you have finished viewing the programme as a bar chart.
Working with projects and programmes
Creating projects and programmes