Browsing through the project hierarchy
Two different types of Asta Siteprogress Mobile user use the Project screen:
- Mobile users use this screen to select the task against which they want to report progress and collect field evidence.
- Administrator users use this screen to select the task for which they want to review field evidence that has been submitted by Mobile users.
The Project screen displays the charts and summary groups that contain tasks and/or ticksheets on which you need to report progress during the current working period in the selected project.
Working with charts and summary groups
Each chart or summary group appears as a grey bar, with the name of the chart or summary group on it:
To expand a chart or summary group and view the subcharts, tasks and ticksheets within it, tap the right-pointing arrow in a grey bar. When a chart or summary group is expanded, the arrow points down:
To contract a chart or summary group and hide the subcharts, tasks and ticksheets within it, tap the down pointing arrow in a grey bar.
To identify where a chart or summary group is located in the project hierarchy, tap  to view its full path.
If Asta Siteprogress Mobile has been configured to allow you to create tasks, tap  to create a new task within a chart or summary group.
Working with tasks and ticksheets
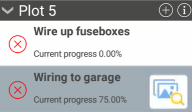
Tasks appear on the Project screen as illustrated below:
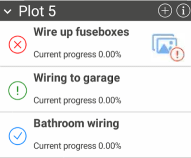
The colour-coded icon to the left of the task name indicates whether the task is due  , overdue
  , or not yet due
  .
.
If you use Asta Siteprogress Mobile to collect field evidence, a  icon against a task indicates that you need to collect field evidence for it.
If you are using a mobile phone, ticksheets appear on the Project screen as illustrated below, one for each plot:
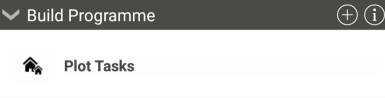
If you are using a tablet or a PC, a "Plot Tasks" row appears for charts and summary groups that contain one or more ticksheets:
To open a task or a ticksheet to view more details and report progress against it or to collect field evidence for it, tap it. Tasks open in the Task Progress screen; ticksheets open in the Ticksheet Tasks screen. You cannot collect field evidence for ticksheet tasks.
Tasks and ticksheets appear with a grey background on the Project screen once they have been edited, as illustrated below:
Searching for specific tasks and ticksheets
If the Project screen displays a large number of tasks and ticksheets, it can be difficult to find the one you need. To search for a specific task or ticksheet, tap in the Search field and start typing. As you type, the list of tasks and ticksheets is limited to those:
- With names that include the text you type.
- With user-defined field content ('String'-type user-defined fields only) that include the text you type - even if the task name does not include the text.
For example, if you type the text 'gar' in the Search field, the list is limited to:
- Tasks with names that include the text 'gar', eg 'Wiring to garage' or 'Garden landscaping'.
- Tasks with one or more 'String'-type user-defined fields that include the text 'gar', eg 'Gardening' or 'Garage'.
To clear your search and redisplay all tasks and ticksheets on the Project screen, clear the text in the Search field or tap  .
.
Sorting tasks and ticksheets
You can sort the tasks and ticksheets within each chart or summary group by name or by natural order - ie the order in which they appear in the project. To specify how to sort tasks and ticksheets within their charts:
- Tap
 to display the menu.
 - Tap Sort by name or Sort by natural order.
The Project screen displays the charts and summary groups that contain tasks on which progress has been reported during the current working period in the selected project.
Working with charts and summary groups
Each chart or summary group appears as a grey bar, with the name of the chart or summary group on it:
To expand a chart or summary group and view the subcharts, tasks and ticksheets within it, tap the right-pointing arrow in a grey bar. When a chart or summary group is expanded, the arrow points down:
To contract a chart or summary group and hide the subcharts, tasks and ticksheets within it, tap the down pointing arrow in a grey bar.
To identify where a chart or summary group is located in the project hierarchy, tap to view its full path.
Working with tasks
Tasks appear on the Project screen as illustrated below; tasks that have been edited have a grey background:
The colour-coded icon to the left of the task name indicates whether the task is due , overdue , or not yet due .
A  icon against a task indicates that the task has field evidence that needs to be reviewed.
To open a task to view more details and review the field evidence that has been collected for it, tap it. Tasks open in the Task Progress screen.
Searching for specific tasks
If the Project screen displays a large number of tasks, it can be difficult to find the one you need. To search for a specific task, tap in the Search field and start typing. As you type, the list of tasks is limited to those:
- With names that include the text you type.
- With user-defined field content ('String'-type user-defined fields only) that include the text you type - even if the task name does not include the text.
For example, if you type the text 'gar' in the Search field, the list is limited to:
- Tasks with names that include the text 'gar', eg 'Wiring to garage' or 'Garden landscaping'.
- Tasks with one or more 'String'-type user-defined fields that include the text 'gar', eg 'Gardening' or 'Garage'.
To clear your search and redisplay all tasks on the Project screen, clear the text in the Search field or tap .
Sorting tasks
You can sort the tasks within each chart or summary group by name or by natural order - ie the order in which they appear in the project. To specify how to sort tasks within their charts:
- Tap to display the menu.
- Tap Sort by name or Sort by natural order.
Downloading and opening projects