Modelling unit networks for use with Line of Balance graphs
Before you can generate a Line of Balance graph, you must model the tasks that you want to include in the graph in a series of unit networks - groups of tasks in which repeated work items are drawn with a series of linked steps to plan a single deliverable.
You can model unit networks in two ways for use with Line of Balance graphs:
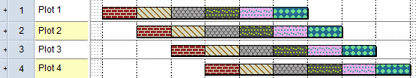
- As multi-task bars, with the bar representing the location of the unit network and the tasks on the bar representing the activities carried out by the different stages.
- As summary groups, with the summary task representing the location of the unit network and the bars in the summary group representing the activities carried out by the different stages.
 Illustration of four unit networks modelled as summary groups
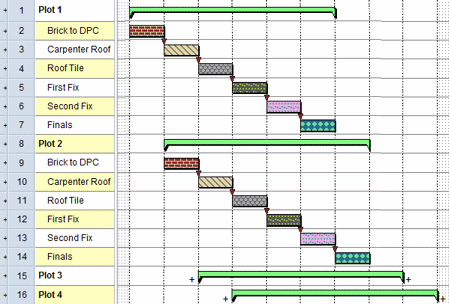
If you choose to model unit networks in this way, it is advisable to create Finish-to-Start links between the individual tasks - as illustrated above - to ensure that the order in which they take place is maintained. Note that in the above illustration, only the Plot 1 and Plot 2 summary tasks are shown in their open state.
To summarise:
- The unit network - the bar or summary task - represents the location at which the individual tasks take place. This may be a plot, a house number or a room, for example.
- The individual tasks on the bar, or the individual bars in the summary group, represent the individual activities that are to be carried out at each location.
Both of these modelling methods are acceptable, although you must use one method or another: it is not possible to use both methods at the same time. Note that the illustrations and examples in this Help assume that you are modelling unit networks as multi-task bars.
Introduction to Line of Balance graphs
Setting up code libraries for use with Line of Balance graphs
Assigning Line of Balance codes to unit networks and individual activities