Editing Line of Balance graphs
Once a Line of Balance graph is displayed, you can edit it to configure the way in which it is displayed.
To specify the way in which unit networks have been modelled:
- Click Properties in the Line of Balance graph pane. The Line of Balance Properties dialog appears.
- Click the Graph Definition tab.
- Click the Bars radio button to specify that you have modelled unit networks as multi-task bars, or click the Summaries radio button to specify that you have modelled them as summary groups.
- Click Close.
To specify the codes to include in a Line of Balance graph:
- Click Properties in the Line of Balance graph pane. The Line of Balance Properties dialog appears.
- Click the Graph Definition tab.
- In the Stages group, specify the code library that you have set up to represent the individual stages - or trades, or gangs - that make up each unit network in the Code library field, then specify the individual stages that you want to include in the graph in the Show graph lines for these codes field.
- Select the code library that you have set up to represent the location breakdown structure that identifies the units achieved on the Y axis of the Line of Balance graph in the Location code library field.
- Click Close.
To specify the drawing style of a Line of Balance graph:
- Click Properties in the Line of Balance graph pane. The Line of Balance Properties dialog appears.
- Click the Drawing Style tab.
- On the Drawing Style tab, use the radio buttons in the Line style group to specify the style with which to display the Line of Balance graph. You can choose from the following styles:
 Join ends
Click the Join ends radio button to specify that you want the lines that represent stages in the graph to be displayed as continuous lines, as illustrated below:
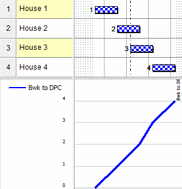
- Each line in the graph joins the finish points of the tasks of the same stage, with the X position being the finish date of the task and the Y position being the number of units achieved at the finish of the task (this information is derived from the sort order that is defined in the 'location' code library).
- The start of the first line segment has an X position of the start date of the task in the first location and a Y position of zero (indicating that no units have been achieved at the start of the task).
- If the Show progress check box is selected, lines that relate to complete tasks are drawn dashed and lines that relate to partially-complete tasks are drawn dashed in proportion to their progress - for example, if a task is 50% complete, the first half of its corresponding line will be drawn dashed.
- If the Show discontinuities check box is selected, lines are drawn as if you were using the One line each task style where there is a gap between the finish of one task and the start of the next that is caused by the stage in question being omitted from a particular location.
One line each taskClick the One line each task radio button to specify that you want the lines that represent stages in the graph to be displayed as broken lines, with a separate line segment being drawn for each task, as illustrated below:
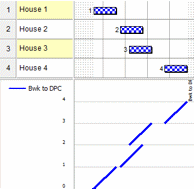
With One line each task selected:
- The start of each line segment has an X position of the start date of the task and a Y position of the number of units achieved at the finish of the task, minus one (this information is derived from the sort order that is defined in the 'location' code library).
- The finish of each line segment has an X position of the finish date of the task and a Y position of the number of units achieved at the finish of the task.
- If the Show progress check box is selected, lines that relate to complete tasks are drawn dashed and lines that relate to partially-complete tasks are drawn dashed in proportion to their progress - for example, if a task is 50% complete, the first half of its corresponding line will be drawn dashed.
- The Show discontinuities check box has no effect.
Solid trapeziumClick the Solid trapezium radio button to specify that you want the lines that represent stages in the graph to be displayed as filled trapeziums, with a separate trapezium being drawn for each task, as illustrated below:
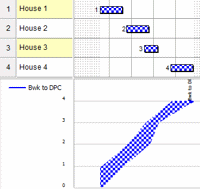
With Solid trapezium selected:
- The top of each trapezium is a horizontal line that joins the start date and finish date of the task.
- The base of each trapezium is a horizontal line that joins the start date and finish date of the task in the previous location (for the first task, the start and finish dates of an inferred previous task of the same duration are used).
- If the Show progress check box is selected, the fill colour or pattern of trapeziums that relate to progressed tasks is drawn with a darker shade, with the shading being progressively darker depending on the amount of progress.
- If the Show discontinuities check box is selected, if there is a gap between the finish of one task and the start of the next, the base of the trapezium that follows the gap is drawn to the same length as its top, as the task in the previous location - which would normally be used to determine the length of the trapezium base - is either absent or does not immediately precede it.
Open trapeziumClick the Open trapezium radio button to specify that you want the lines that represent stages in the graph to be displayed as outlined trapeziums, with a separate trapezium being drawn for each task, as illustrated below:
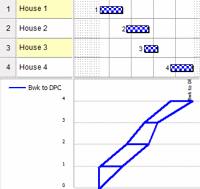
- The top of each trapezium is a horizontal line that joins the start date and finish date of the task.
- The base of each trapezium is a horizontal line that joins the start date and finish date of the task in the previous location (for the first task, the start and finish dates of an inferred previous task of the same duration are used).
- If the Show progress check box is selected, trapeziums that relate to complete tasks are filled with the colour or pattern of the appropriate stage code and trapeziums that relate to partially-complete tasks are partially filled in proportion to their progress - for example, if a task is 50% complete, the first half of its corresponding trapezium will be filled with the colour or pattern of the appropriate stage code.
- If the Show discontinuities check box is selected, if there is a gap between the finish of one task and the start of the next, the base of the trapezium that follows the gap is drawn to the same length as its top, as the task in the previous location - which would normally be used to determine the length of the trapezium base - is either absent or does not immediately precede it.
- Select the Show progress check box to highlight progressed tasks in the Line of Balance graph, or clear the check box to omit progress information from the graph. The way in which progress is highlighted depends on the line style you choose - see above for details.
- Select the Show discontinuities check box to display breaks in the lines that represent stages in the graph where there are gaps between the finish of one task and the start of the next that are caused by any of the following reasons, or clear the check box to draw the lines through such gaps as if they did not exist:
- Where a 'location' code has not been assigned to a bar or summary task that represents the corresponding unit network.
- Where a 'stages' code has not been assigned to an activity that represents the corresponding stage.
- Where a unit network does not include a particular stage.
- Where a stage in one unit network does not start immediately after the finish of the same stage in the previous unit network.
- In the Labels group, specify whether you want to display labels that identify stages, gangs or trades in the Line of Balance graph, and whether to colour them according to the fill colour of the corresponding 'stages' code library entries, or to apply the same colouring to all labels.
- Use the fields in the Appearance group to specify the way in which the graph appears in the Line of Balance graph pane.
- Click Close.
To specify the way in which horizontal ruling lines are used to differentiate between items on the Y axis in Line of Balance graphs:
- Click Properties in the Line of Balance graph pane. The Line of Balance Properties dialog appears.
- Click the Ruling Lines tab. Each row on this tab relates to a level in the location breakdown structure hierarchy. If you have set up a flat, non-hierarchical location breakdown structure, you only need to define a ruling line for one level. If you have set up a hierarchical location breakdown structure, you should define a ruling line for each of the levels in the hierarchy, clicking Add to add new rows to the dialog as required.
- For each row:
- Click the Level font column and specify the font with which to display text in the Y axis for items at this level of the location breakdown structure.
- Select the line style in the Ruling line column.
- Select the Shown check box to differentiate between items on the Y axis at this level of the location breakdown structure using ruling lines, or clear the check box to display items at this level without ruling lines appearing between them.
- Click Close.
The Y axis of a Line of Balance graph displays entries from the location breakdown structure (the 'location' code library) that you have set up. Your location breakdown structure can be flat, with all entries at the same level, or hierarchical, with entries categorised in different folders at levels within the code library. If you have set up a hierarchical location breakdown structure, you can specify a different ruling line for each of the levels. This makes it easy to distinguish between different levels in the location breakdown structure when you view the graph.
In the following illustration, the topmost level of the location breakdown structure hierarchy (Site 1, Site 2) is identified using bold blue text, while the second level is identified using smaller italic text. Note also that a different ruling line - a dashed line - has been applied to the topmost level to highlight the different sites.
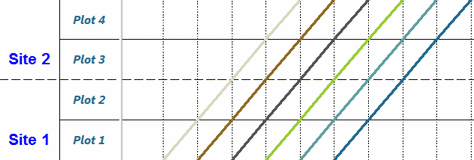
In the location breakdown structure illustrated above, Site 1 and Site 2 represent code library folders within the 'location' code library, while Plot 1, Plot 2, Plot 3 and Plot 4 represent individual codes within these folders.
Generating a Line of Balance graph
Modelling unit networks for use with Line of Balance graphs
Setting up code libraries for use with Line of Balance graphs