Introduction to Line of Balance graphs
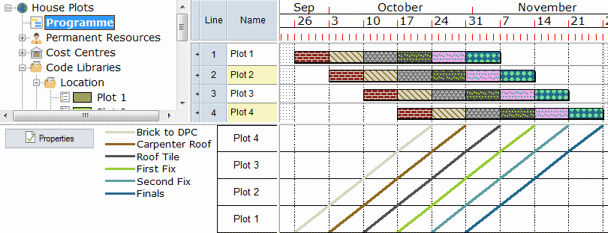
You can use Line of Balance graphs to analyse and plan work or production rates in groups of tasks in which repeated work items are drawn with a series of linked steps to plan a single deliverable - these are known as 'unit networks'. One use of unit networks would be for planning the construction of a number of house plots: as the same tasks must be carried out for each plot, you could create a unit network for each individual plot - or 'location' - with each unit network comprising the activities that must be carried out during the construction of the corresponding plot. A simplified illustration of this is shown below, where each bar relates to a different location and each differently-coloured task relates to an activity that must be carried out on the plot:

The house construction analogy above can be used to illustrate the usefulness of Line of Balance graphs. Each activity within a unit network represents a different 'stage' that must be carried out by a particular gang or trade. In a Line of Balance graph, the repetitive work of each stage is shown as a single line, as illustrated below:

The rate of production of a stage is indicated by the steepness of its line - the steeper the line, the greater the rate of production - and the relationship of one stage to the subsequent stage is indicated by the space between the lines. The illustration above depicts a perfect scenario in which there are no conflicts; the continuous lines in the Line of Balance graph show that the start of each stage in a unit network follows on immediately after the finish of the stage in the previous unit network.
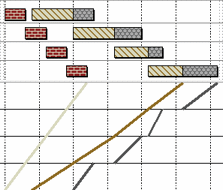
In the above scenario, if one stage was running behind schedule, it would impact the following stages. This is illustrated below, where we can see that delays to the second stage - 'Carpenter Roof' - have resulted in the third stage - 'Roof Tile' - working discontinuously. The delays to the second stage are illustrated by the wider gap between the first and second stage lines; the discontinuous working of the third stage is illustrated by a broken line:

You can choose to display Line of Balance graphs in a variety of drawing styles. Some drawing styles - such as 'one line each task', as illustrated above, are better for highlighting discontinuous working than others.
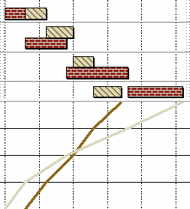
Conflicts may arise as stages are progressed in the various unit networks, as each stage or team may work at a different rate. The following illustration illustrates a conflict between the first two stages in the unit networks - 'Brick to DPC' and 'Carpenter Roof' - which must be resolved (note that the bars in this example have been configured to allow the tasks within them to overlap):

You can resolve conflicts and optimise projects by editing Line of Balance graphs directly, either by moving tasks by clicking and dragging in the graph or by adjusting the work face frequency of gangs, trades or stages to increase or decrease their rate of production.
In order to produce Line of Balance graphs, you must carry out the following steps:
- Model your activities into unit networks.
- Set up code libraries to represent the locations and stages.
- Assign 'location' and 'stages' codes to your unit networks and to individual activities.
Note that if hammocks are displayed in the project view and you click a hammock to display its contents in the current view, Line of Balance graphs will not work, even if the hammock contains bars and tasks that are included in a Line of Balance graph.
Modelling unit networks for use with Line of Balance graphs
Setting up code libraries for use with Line of Balance graphs
Assigning Line of Balance codes to unit networks and individual activities