Working with charts
With Asta Powerproject you can organise your project plan as a connected tree or hierarchy, gradually breaking the project down further and further into more and more detail. This structure, where general tasks are broken down into more specific tasks, is sometimes known as a work breakdown structure (WBS).
The following project view chart hierarchy is also displayed as a tree structure:
|
|
|
|
Project view chart hierarchy |
The same hierarchy shown as a tree structure |
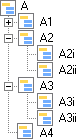
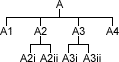
The programme chart has four expanded tasks: A1, A2, A3 and A4. Each task is expanded into more detail in a subordinate chart or subchart. The A2 and A3 charts both contain further expanded tasks or subcharts. You could substitute summary tasks for the expanded tasks in the hierarchy above.
A subchart can contain further expanded tasks, summary tasks or hammocks in addition to normal tasks. This is sometimes known as 'nesting'.
The duration of an expanded task is set by the overall duration of the tasks in the subchart. You can set a duration for an expanded task - perhaps your first guess for how long it will take - but this will be changed if the total duration of tasks in the subchart (and any nested subcharts) is different.
This means that you do not have to get the duration of expanded bars correct when you create them; the duration is set when you fill in the detail within the subcharts. When working within a subchart, the boundaries of the expanded bar are shown so that you can see if you are going to extend or shorten the duration of the expanded bar, and possibly the project.
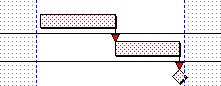
The illustration below shows the chart boundaries within a subchart, marked with a dashed blue line in this example (the blue line will not appear in your projects). Drawing or extending tasks into the chart boundaries will extend the duration of the expanded task, which in turn will extend the duration of the whole project:
You can move an expanded task to move the entire contents of its subchart.
You can build up a portfolio of projects by identifying that individual charts and summary groups are projects themselves.
You can specify whether to display expanded tasks using their standard appearance, as normal tasks, or as subheadings, and you can highlight bars that indicate the project hierarchy - ie those that contain summary tasks and expanded tasks - by applying a specific colour and font to them for each level of the project hierarchy.
If your projects contain networks of tasks that are similar to each other, you can save time in planning projects by creating 'task pools' - also known as 'fragnets' and 'templates'. Task pools are networks of tasks that you can use as templates for the creation of multiple, similar task networks within a project. You create task pools by planning the tasks that are required in a chart or summary group, then creating a task pool from the chart or summary group - the task pool is a copy of the chart or summary group.
Moving expanded tasks, summary tasks and hammocks
Counting the number of items in summary groups and charts
Building up a portfolio of projects
Specifying how to display expanded tasks, summary tasks and hammocks