Displaying baseline information in the bar chart
Once you have created a baseline, you can display the baseline tasks and allocations in the bar chart for comparison against the actual project tasks and allocations. You cannot edit the baseline tasks or allocations but you can view information about them. If you open a baseline as a separate project, you can edit the baseline tasks and allocations.
You can change the appearance and scale of baseline tasks and allocations when they are displayed in the bar chart.
To display baseline information in the bar chart:
- On the Format tab, in the Format group, click Format Bar Chart. The Format Bar Chart dialog appears.
- Click the Baselines tab.
- Select the baselines whose tasks and/or allocations you want to display in the project. You can select any baselines in the project, including baselines of views other than the current view. To turn a baseline off, clear its check box.
Select Current Baseline to compare the live data against the baseline that is defined as being current. If you have associated different baselines with individual projects in a portfolio, you can display information from the project baselines in the bar chart by selecting the Project Baseline check boxes. - To display baseline progress lines, select the Show progress period lines check box, then select a baseline from the field below the check box. The progress periods in that baseline are listed in the field below (only the progress periods that were in use in the project are baselined). Select the progress periods whose progress lines you want to display.
- From the Appearance group, choose whether the baseline tasks and allocations take their appearance from the default set up on the Baseline/What If Manager, or from the appearance of the corresponding task or allocation in the current project.
- Select the Show as non-critical check box to display all baseline tasks without critical marking, regardless of whether they are on the critical path in the baseline, or clear the check box to display tasks that are on the critical path in the baseline as critical, provided that the Critical path check box has been selected on the Schedule tab of the Format Bar Chart dialog.
- Select the Always show new baselines check box to display new baselines automatically when they are created or imported.
If you are working in a multi-user environment - including collaborating on an Asta Vision programme - when this check box is selected, only the user that creates or imports a baseline has their views updated automatically to display the new baseline. - Select the Show baselines on their own lines check box to display the baseline tasks on separate lines instead of on the same line as their corresponding task in the project. When you display baseline tasks on separate bars, you can view more information about the baseline tasks.
- Click Close or Apply to display the selected baseline information.
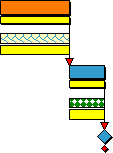
Baseline tasks and allocations are displayed below their corresponding tasks and allocations in the current project, as illustrated below, where the baseline tasks and allocations appear in yellow:
If you choose to display a baseline of a view other than the current view, baseline tasks are only displayed for tasks that were in the baselined view.
Any options that you select on the Format Bar Chart dialog are applied only to the current view. If you want to display the same baseline in more than one view, you must choose to display it in each view in turn.
When a baseline is displayed in the bar chart, you cannot open it as a separate project.
Another way of displaying baseline information in the bar chart is by displaying a 'jagged progress' view - also known as a 'zig-zag progress' view and as a 'Manhattan skyline' view - to show the effect of current progress on a baselined plan. In a 'jagged progress' view, the percentage complete values of the tasks in a live project are superimposed onto the tasks in the current baseline. This gives you an indication of how the project is progressing against the original plan.
You can also turn the display of baseline information on and off instantly using a display switch.
Displaying baseline information in the spreadsheet
Showing the effect of current progress on a baselined plan
Specifying which baseline is the "current baseline"
Merging new and changed data into existing baselines
Associating different baselines with individual projects
Opening a baseline as a separate project
Importing a project for use as a baseline