Creating baselines and comparing pull plans against them
A baseline is a snapshot - a complete copy - of a pull plan at a particular point in time. You can create as many baselines as you want for a pull plan. Once you have created a baseline, you can display it in the whiteboard and compare the 'live' pull plan against it to track changes that have been made to the pull plan since the baseline was created.
Baselines are useful for tracking the progress of a pull plan. For example you could:
- Baseline the pull plan before work gets underway so that you have a record of the planned schedule. When work starts on the pull plan, you can compare the actual progress against the baseline of the original plan.
- Baseline the pull plan regularly throughout its duration, for example at the end of every week or at major milestones, so that you have a history of the pull plan's progress. By comparing the baselines to the live pull plan, you can see exactly when a pull plan becomes behind or ahead of schedule.
In the illustrations in this topic, the swimlanes represent project teams. They may represent build locations rather than project teams in your whiteboard, depending on what you have selected using the Swimlanes control.
There are two ways of creating baselines:
- Configure Asta Connect to create baselines of a project's pull plans automatically, daily, weekly or monthly, at a time of your choice.
- Create a baseline of a pull plan manually, at any time.
Once a pull plan baseline has been created, you can display information from the baseline in the whiteboard. This enables you to compare 'live' data in the pull plan against the data as it was when the baseline was created.
To display information from a baseline in the whiteboard:
- Click Pull Plans in the left pane. The Pull Plans page appears.
- Click a pull plan in the list.
- Click Whiteboard. The Pull Plan Whiteboard page appears.
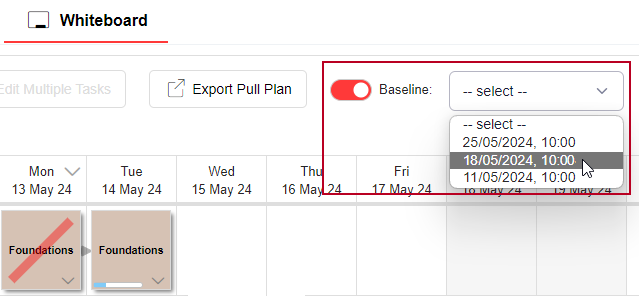
- Click the Baseline toggle at the top of the whiteboard. The drop-down field to the right of it, which displays baselines that have been taken of the pull plan, becomes available.
The drop-down field displays all of the pull plan's baselines, except any that are hidden or have been deleted. - Select the baseline against which you want to compare the live data from the drop-down field:

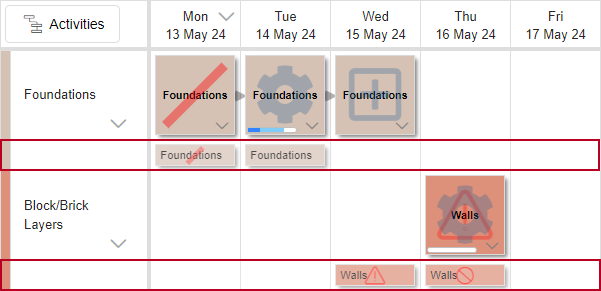
A new, narrow, swimlane appears underneath each swimlane in the whiteboard, displaying information from the selected baseline. These are highlighted in red below - although in the whiteboard, the red highlighting does not appear:

If you find it difficult to read information about a project team's baseline tasks in a baseline swimlane, edit the project team and select a darker colour in the Task Text Colour field on the Edit Project Team dialog.
To turn off the baseline display, turn off the Baseline toggle.
Differences between tasks in the live data and in the baseline are highlighted as follows:
| Difference | Appearance | Notes |
|---|---|---|
| No difference between live data and baseline |

|
The task in the live swimlane has the same formatting as the corresponding task in the baseline swimlane. In this example, the task is 100% complete in the live data and in the baseline, so the task is shown with a diagonal line drawn across it in both swimlanes. |
| Task added to pull plan since baseline was created |

|
The task in the live swimlane has a plus symbol drawn across it to indicate that it has been added to the pull plan since the baseline was created. No corresponding task appears in the baseline swimlane. |
| Task deleted from pull plan since baseline was created |

|
No task appears in the live swimlane. The task that has been deleted appears in the baseline swimlane with a crossed-out circle drawn across it to indicate that it has been deleted from the pull plan since the baseline was created.
If another task has been moved into the same cell in the whiteboard as the task that was deleted, this will appear in the live swimlane above the deleted task in the baseline swimlane, but it will not correspond to the task in the baseline swimlane.
If an entire swimlane has been deleted from the pull plan since the baseline was created, the baseline swimlane will be displayed with no corresponding live swimlane, with a crossed-out circle drawn across each of the tasks in the baseline swimlane. |
| Task details changed in pull plan since baseline was created |

|
The task in the live swimlane has a cog symbol drawn across it to indicate that its details have been changed in the pull plan since the baseline was created. No cog is drawn across the task in the baseline swimlane. |
| Task progress changed in pull plan since baseline was created |

|
The task in the live swimlane has a cog symbol drawn across it to indicate that its details have been changed in the pull plan since the baseline was created; in the progress bar, the amount of progress that was recorded against the task when the baseline was created is shown in dark blue, and any subsequent progress is shown in light blue. No cog or progress bar is drawn across the task in the baseline swimlane.
If a task's progress has been changed to 100% since the baseline was created, the task is shown with a diagonal line drawn across it in the live swimlane in addition to the progress bar. |
| Task status changed to 'At Risk/Blocked' since baseline was created |

|
The task in the live swimlane has a warning triangle and a cog drawn across it to indicate that its status has changed to 'At Risk/Blocked' since the baseline was created. No warning triangle or cog is drawn across the task in the baseline swimlane. |
| Task risk resolved since baseline was created |

|
The task in the live swimlane has a cog drawn across it to indicate that its details have been changed in the pull plan since the baseline was created. A warning triangle is drawn across the task in the baseline swimlane to indicate that its status was 'At Risk/Blocked' when the baseline was created. |
If tasks have been moved around in a pull plan since the baseline was created, it can be difficult to identify which tasks in the live data correspond to which tasks in the baseline. To identify a live task's corresponding baseline task, hover the mouse pointer over the task. The task, and its corresponding task in the baseline, are highlighted with a dotted outline:

In the same way, you can hover the mouse pointer over a task in the baseline swimlane to identify its corresponding task in the live data.