Carrying out risk analysis
To access the Risk Analysis dialog, on the Project tab, in the Data group, click Risk Analysis.
You use the Risk Settings tab of the Risk Analysis dialog to configure the way in which risk analysis is carried out on a project, and then to carry out risk analysis.
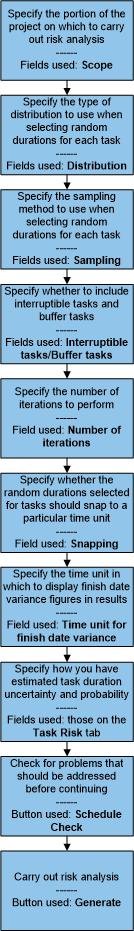
The following flowchart shows the steps that are involved in carrying out risk analysis. Each step is explained in more detail in the sections that follow.
| Field/Button | Description |
|---|---|
| All | Click this radio button to specify that you want to carry out risk analysis on the entire programme of projects. |
| Branch | Click this radio button to specify that you want to carry out risk analysis on the currently selected branch of the project only. |
| View | Click this radio button to specify that you want to carry out risk analysis on the tasks in the current view only. |
| Uniform |
Click this radio button to specify that you want to apply a uniform - or linear - distribution to the way in which the duration of tasks is selected during risk analysis.
Using this distribution, a random value between the minimum and maximum duration range specified is selected for each task for each iteration; the current duration of the task is ignored. If you plotted a graph of hundreds of such random values, the graph would approximate a straight line.
The uniform distribution will provide the most useful results in cases when you know that the duration of tasks will fall somewhere between two values, but you have no feel for the probable duration. This may be the case if someone else has planned a schedule.
If you have applied a specific distribution to one or more individual tasks in the project, the distributions that you have specified against tasks will override the distribution that you choose on this dialog, for those tasks only. |
| Normal |
Click this radio button to specify that you want to apply a normal distribution to the way in which the duration of tasks is selected during risk analysis.
Using this distribution, a random value within the minimum and maximum duration range specified is selected for each task for each iteration; the values selected tend towards the middle of the duration range. If you plotted a graph of hundreds of such random values, the graph would approximate a normal curve.
The normal distribution will provide the most useful results in cases when you know that the duration of tasks will fall somewhere between two values, and is most likely to fall midway between them.
If you have applied a specific distribution to one or more individual tasks in the project, the distributions that you have specified against tasks will override the distribution that you choose on this dialog, for those tasks only. |
| Skewed normal |
Click this radio button to specify that you want to apply a skewed normal distribution to the way in which the duration of tasks is selected during risk analysis.
Using this distribution, a random value between the minimum and maximum duration range specified is selected for each task for each iteration; the values selected tend towards the current duration of the task within the project. If you plotted a graph of hundreds of such random values, the graph would approximate a normal curve, but with a peak around the current duration.
The skewed normal distribution will provide the most useful results in cases when you know that the duration of tasks will fall somewhere between two values, and is most likely to fall on the current duration, in other words when you are fairly confident that the current duration of tasks in the schedule is accurate.
If you have applied a specific distribution to one or more individual tasks in the project, the distributions that you have specified against tasks will override the distribution that you choose on this dialog, for those tasks only. |
| Skewed triangular |
Click this radio button to specify that you want to apply a skewed triangular distribution to the way in which the duration of tasks is selected during risk analysis.
This distribution produces similar results to the skewed normal distribution. As with the skewed normal distribution, a random value between the minimum and maximum duration range specified is selected for each task for each iteration; the values selected tend towards the current duration of the task within the project. If you plotted a graph of hundreds of such random values, the graph would approximate a triangle, with its apex around the current duration.
As with the skewed normal distribution, the skewed triangular distribution will provide the most useful results when you are fairly confident that the current duration of tasks in the schedule is accurate.
If you have applied a specific distribution to one or more individual tasks in the project, the distributions that you have specified against tasks will override the distribution that you choose on this dialog, for those tasks only. |
| Monte Carlo |
Click this radio button to specify that you want to apply the Monte Carlo sampling method when carrying out risk analysis.
|
| Latin Hypercube |
Click this radio button to specify that you want to apply the Latin hypercube sampling method when carrying out risk analysis.
This sampling method may give better results if you choose to perform fewer iterations, as it ensures that the iterations that are performed select task durations from across the entire duration range, avoiding the clustering effect that can occur when the Monte Carlo method is used with a relatively small number of iterations.
|
| Interruptible tasks |
Select this check box if you want to include interruptible tasks in the risk analysis calculations, or clear the check box to exclude them, meaning that their durations will not change as a result of risk analysis.
As the duration of interruptible tasks can change each time a project is rescheduled, depending on the progress of the tasks to which they are linked, it is advisable to exclude interruptible tasks from risk analysis calculations in most cases. |
| Buffer tasks |
Select this check box if you want to include buffer tasks in the risk analysis calculations, or clear the check box to exclude them, meaning that their durations will not change as a result of risk analysis.
As the duration of buffer tasks can change each time a project is rescheduled, depending on the progress of the tasks to which they are linked, it is advisable to exclude buffer tasks from risk analysis calculations in most cases. |
| Number of iterations | Enter the number of iterations - cycles of selecting a duration for each task and performing critical path analysis - that you want to be performed during risk analysis. The more iterations you specify, the longer the risk analysis will take, but the more accurate will be the results. |
| Snapping |
Specify whether you want the durations of tasks to snap to a particular time unit when random durations are selected for each task during risk analysis. You may want to do this in order to prevent tasks ending up with what you might consider to be unrealistic durations, such as 3d 1h 7m 23s.
Note that choosing to snap to each task's current duration time unit might provide undesirable results, especially if task durations have been defined using large time units such as weeks or months. |
| Time unit for finish date variance | Select the time unit in which to display values in the Finish date variance column on the Results tab once risk analysis is complete. This column displays the variance between the current project finish date and the project finish date within each iteration. |
| Schedule Check |
Click this button to reschedule the project prior to carrying out risk analysis, in order to check for any scheduling problems that ought to be addressed before risk analysis is carried out.
When you click this button, either the entire programme of projects, the current branch, or the tasks in the current view are rescheduled - according to which Scope radio button you have selected on this dialog - and a reschedule report is displayed in your web browser. The reschedule report will highlight issues that you may like to address before carrying out risk analysis.
Once the reschedule is complete, it is immediately undone and the project reverts back to the state it was in before you clicked this button.
Depending on the size of your project and the selected scope, carrying out a pre-risk analysis schedule check can take a considerable amount of time. |
| Generate |
Click this button to carry out risk analysis on the project using the settings that you have configured on this dialog.
Depending on the size of your project and the selected scope, carrying out risk analysis can take a considerable amount of time. |
| Cancel | Click this button to close the dialog without saving any of the changes that you have made. |
| Apply | Click this button to save the settings that you have entered into the dialog, without carrying out risk analysis or closing the dialog. |
How do I...
- Click the All radio button to specify that you want to carry out risk analysis on the entire programme of projects.
- Click the Branch radio button to specify that you want to carry out risk analysis on the currently selected branch of the project.
- Click the View radio button to specify that you want to carry out risk analysis on the tasks in the current view only.
- Click the Uniform radio button to specify that you want to apply a uniform - or linear - distribution, which will provide the most useful results in cases when you know that the duration of tasks will fall somewhere between two values, but you have no feel for the probable duration.
- Click the Normal radio button to specify that you want to apply a normal distribution, which will provide the most useful results in cases when you know that the duration of tasks will fall somewhere between two values, and is most likely to fall midway between them.
- Click the Skewed normal radio button to specify that you want to apply a skewed normal distribution, which will provide the most useful results in cases when you are fairly confident that the current duration of tasks is accurate.
- Click the Skewed triangular radio button to specify that you want to apply a skewed triangular distribution, which will provide the most useful results in similar circumstances to those that favour the skewed normal distribution.
If you have applied a specific distribution to one or more individual tasks in the project, the distributions that you have specified against tasks will override the distribution that you choose on this dialog, for those tasks only.
- Click the Monte Carlo radio button to specify that you want to apply the Monte Carlo sampling method.
- Click the Latin Hypercube radio button to specify that you want to apply the Latin Hypercube sampling method, which may give better results if you choose to perform fewer iterations.
- Select the Interruptible tasks check box if you want to include interruptible tasks in the risk analysis calculations, or clear the check box to exclude them, meaning that their durations will not change as a result of risk analysis.
- Select the Buffer tasks check box if you want to include buffer tasks in the risk analysis calculations, or clear the check box to exclude them, meaning that their durations will not change as a result of risk analysis.
As the duration of interruptible tasks and buffer tasks can change each time a project is rescheduled, depending on the progress of the tasks to which they are linked, it is advisable to exclude them from risk analysis calculations in most cases.
Enter the number of iterations - cycles of selecting a duration for each task and performing critical path analysis - in the Number of iterations field. The more iterations you specify, the longer the risk analysis will take, but the more accurate will be the results.
- Select No snapping in the Snapping field to allow tasks to be given any duration during risk analysis, without snapping to a particular time unit.
- Select Snap to task unit in the Snapping field to force task durations to snap to each task's current duration time unit, ie the time unit that was applied to the task when its duration was last edited. For example, if a task was last given a duration of 3w, its current duration time unit would be weeks; if a task was last given a duration of 2d, its current duration time unit would be days.
- Select Snap to given unit in the Snapping field to force task durations to snap to a specific time unit, that you select in the field to the right.
Select a time unit in the Time unit for finish date variance field.
Click Schedule Check. Either the entire programme of projects, the current branch, or the tasks in the current view are rescheduled - according to which Scope radio button you have selected on this dialog - and a reschedule report is displayed in your web browser. The reschedule report will highlight issues that you may like to address before carrying out risk analysis.
Once the reschedule is complete, it is immediately undone and the project reverts back to the state it was in before you clicked this button.
Click Generate.
Before you carry out risk analysis, ensure that you have used the fields on the Task Risk tab of the dialog to specify the way in which you have estimated the duration uncertainty and probability of the tasks within the project.
It is a good idea to baseline your project before you carry out risk analysis. This enables you to compare the original project (the baseline) with the project as it has changed during risk analysis if you choose subsequently to apply an iteration to the live schedule.
Specifying how you have estimated the duration uncertainty and probability of tasks