Viewing a histogram of resource allocations

You can use histograms to view information about the usage of resources in your projects. For example, you can graph a resource's allocation, over-allocation and availability. Histograms are useful resource management tools as they enable you to anticipate any fluctuations in resource usage and take corrective action, hence avoiding any periods of over or under-allocation.

There are a wide range of histogram graphs provided with Asta Powerproject, and you can create your own to display the precise information you want. Here, you will graph the availability, allocation and over-allocation of the Bricklayers permanent resources.

  1. On the View tab, in the Graph group, click New Histogram. A new pane, the histogram pane, is added along the bottom of the window.
  2. Right-click the histogram pane and select Format from the menu that appears. The Details tab of the Format Histogram dialog appears:

    The Details tab of the Format Histogram dialog
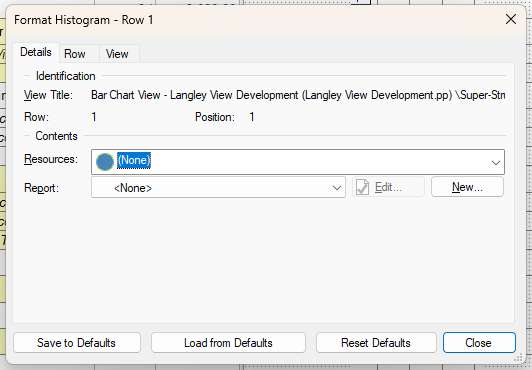
  3. Click in the Resources field. A hierarchical list of resources and cost centres appears.
  4. Click the + icon to the left of the Site Resources resource folder, then select the check box to the left of the Bricklayers permanent resource folder to indicate that you want to graph the usage of bricklayers:

    Selecting bricklayers
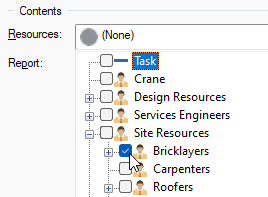
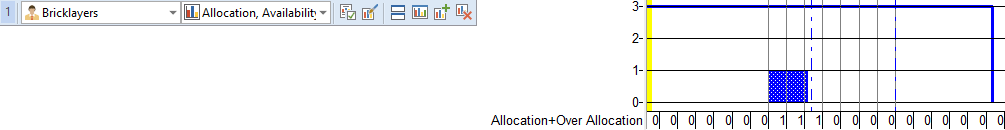
  5. Click away from the Resources field, then select "Allocation, Availability and Over Allocation" in the Report field. This is a predefined histogram report.
  6. Click the Row tab of the dialog.
  7. Select "Stack All" in the Stacking field to indicate that you do not want the selected graphs to obscure each other.
  8. Click Close. The histogram appears in the new pane at the bottom of the window:

    The histogram in the new pane at the bottom of the window

    The area of the histogram, which is displayed in blue to indicate allocation, matches the duration of the Ground Floor Brickwork and First Floor Brickwork tasks: the tasks to which bricklayer resources have been assigned. The blue line indicates the availability of bricklayers: three are available.
  9. On the View tab, in the Graph group, click Delete Histogram. The histogram pane disappears.

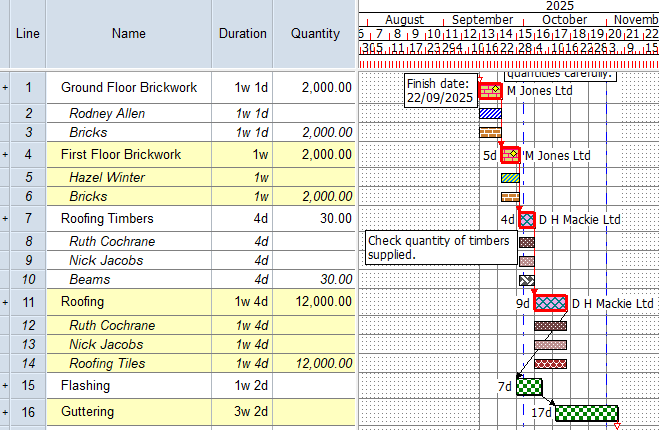
Your project should now look something like this (note that the dates and durations of tasks, and the appearance of codes, annotations and resources, may be different):

Illustration of the project at this stage

Previous Next
Assigning resources to tasks Creating a library of cost centres