Reporting variances against baselines
As a project progresses, it can be useful to report variances between the live data and the baseline data. You can do this easily by displaying fields in the spreadsheet that refer to baseline data, and to variances between the live data and the baseline data. Here, you will configure the spreadsheet to display the finish date variance against the baseline:
- Right-click the heading of the Cost column in the spreadsheet and select Remove this Column from the menu that appears.
- Right-click the heading of the Finish column in the spreadsheet and select Add Column - Date - Finish from the menu that appears. You may need to scroll to the right of the spreadsheet to see this column. A new Finish column appears to the left of the existing Finish column and the Table Definition Properties dialog appears:
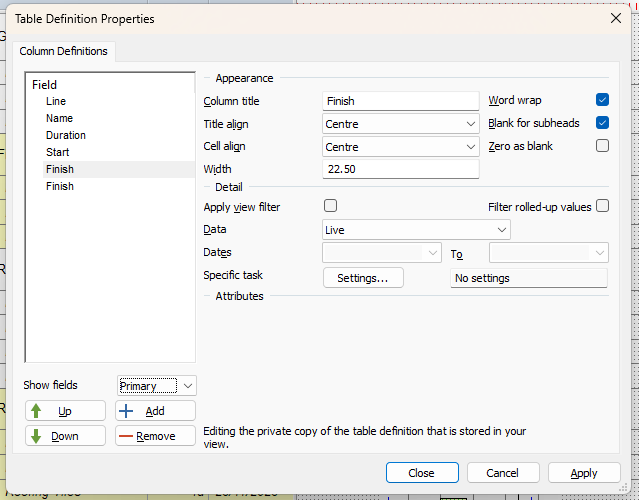
- In the Column title field, enter "Planned Finish".
- In the Data field, select "Current Baseline", to specify that this column should refer to data in the current baseline.
- Click Close.
- Right-click the heading of the Planned Finish column in the spreadsheet and select Add Column - Date - Finish variance from the menu that appears. A new Finish variance column appears to the left of the Planned Finish column and the Table Definition Properties dialog appears.
- This column is configured to refer to the current baseline automatically, so click Close.
- Position the mouse pointer over the heading of the Finish variance column until the cursor appears like this -
 - and click and drag the column until it appears to the right of the Finish column:
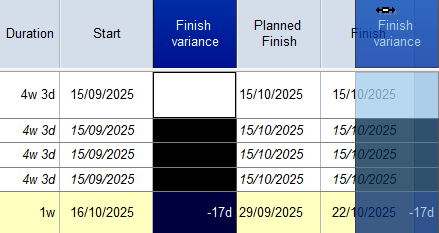
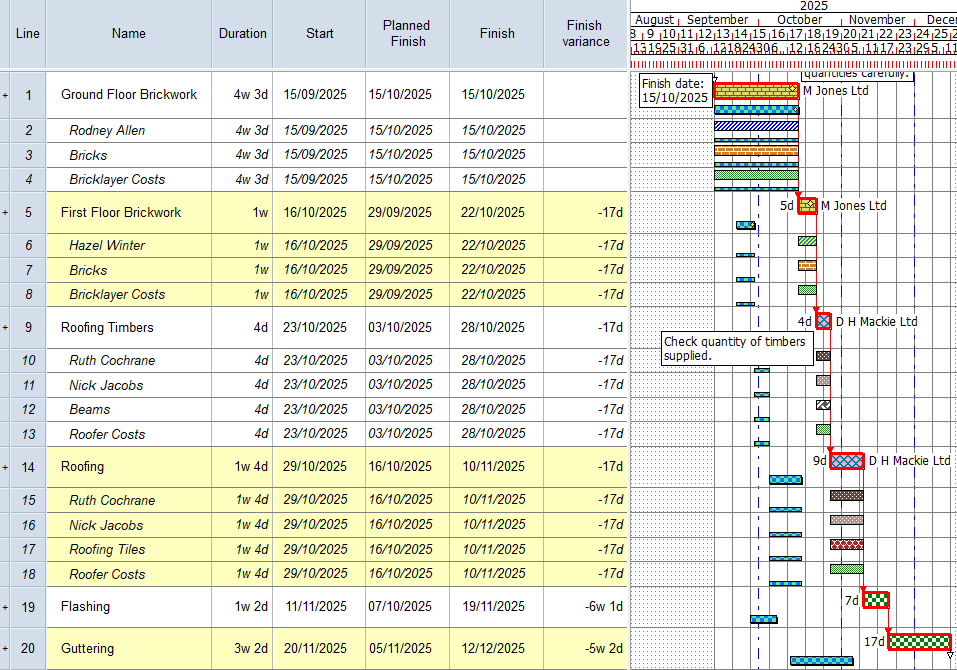
The spreadsheet now displays the planned finish date of each task, taken from the baseline; the finish date of each task, taken from the live data; and the variance between the two dates.
Your project should now look something like this (note that the dates and durations of tasks, and the appearance of codes, annotations, resources
| Previous | Next |
| Baselining projects | Creating a library of progress periods |