Formatting the date zone
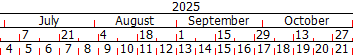
The date zone illustrates the time span of a project. You can specify which time units - days, weeks, months, etc - are displayed in the date zone. By default the date zone includes lines showing the year, month, week start date and week number:
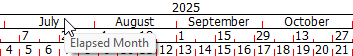
You can see what information each line displays by positioning the mouse pointer over a line. A popup appears, showing you what the line displays:
You learned earlier how to adjust the scale of the project using the date zone. You will now learn how to format the date zone in other ways.
Splitting the date zone into different scale zones
You can display up to three horizontal scale zones within the bar chart. For example, you could show the past and the future at a smaller scale, but show the current month's work at a larger scale. This effect is achieved by splitting the date zone into three date zone sections. Each date zone section can have its own horizontal scale and vertical grid lines.
To split the date zone into different scale zones:
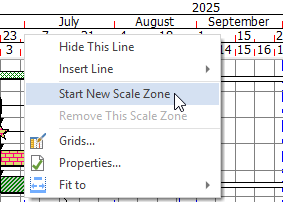
- Right-click the date zone at the point at which you want to start a different scale zone and select Start New Scale Zone from the menu that appears:
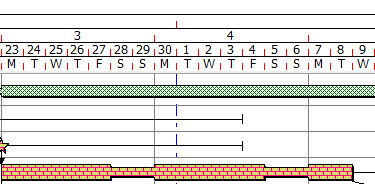
A vertical hairline is drawn on the date zone to indicate where the new date zone section begins: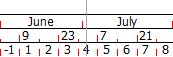
- Right-click the date zone at another point at which you want to start a different scale zone and select Start New Scale Zone from the menu that appears. A second vertical hairline appears in the date zone:
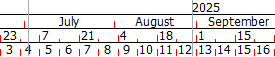
- Position the mouse pointer over one of the red vertical lines within the middle scale zone of the date zone until the pointer appears like this -
 - then click and drag to the left or right to adjust the scale of the bar chart. Note that the revised scale applies only to the dates defined by the scale zone:
To remove a scale zone from the date zone, right-click in the date zone within the scale zone you want to remove and select Remove This Scale Zone from the menu that appears. The scale zone is removed from the date zone.
Remove the middle and right-hand scale zones from your project now.
Resizing the date zone so that all tasks appear on the screen from start to finish
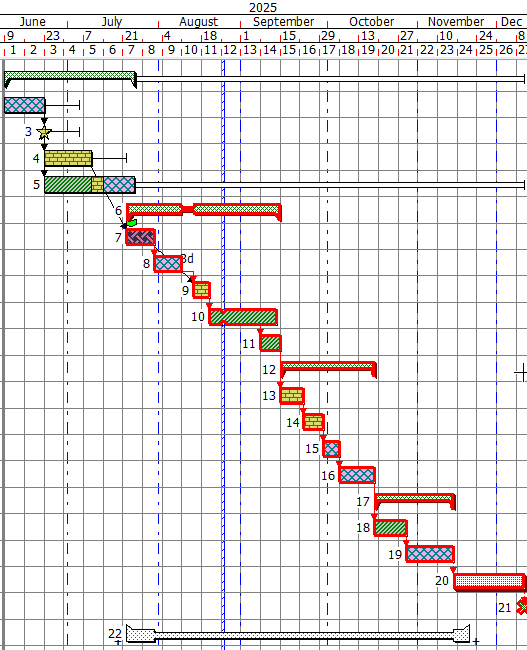
When you work with large projects, you may find that not all of the tasks from the start to the finish of the project appear on the screen at the same time. You can configure the date zone to display the complete time zone of the project, from start to finish.
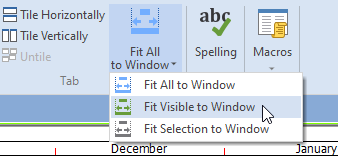
To do this, on the View tab, in the Tab group, click  . The scale of the date zone is adjusted to display the complete time zone of the project:
If you click the drop-down arrow in this Ribbon control, a drop-down menu appears. You can use this to change the scale of the date zone to display the time zone of all visible tasks, or the time zone of all tasks that are currently selected:
Configuring the lines that are displayed in the date zone
The date zone can contain up to ten lines of date information. You can configure the date zone to display information that is most useful to you.
To add a line to the date zone:
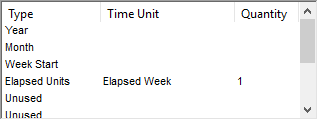
- Right-click the date zone and select Properties from the menu that appears. The General tab of the Date Zone Properties dialog appears. The grid on the right side of the dialog shows the lines that are currently displayed in the date zone, with a number of "Unused" lines appearing beneath:
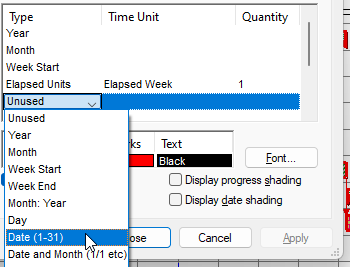
- Add a line to the date zone that displays the date by clicking the first "Unused" line and selecting "Date (1-31)" from the dropdown list that appears:
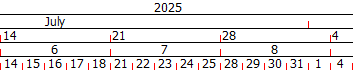
- Click Apply. A new line appears in the date zone, displaying the date (you may have to adjust the scale of the date zone to see all dates):
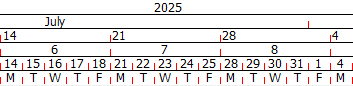
- Display the Day in the next "Unused" line and click Close. A new line appears in the date zone, displaying the day of the week:
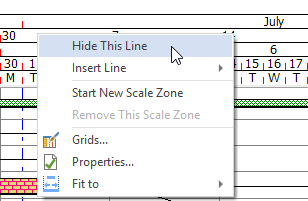
To remove a line from the date zone, right-click the line in the date zone and select Hide This Line from the menu that appears. Do this now to hide the Week (Start) line from the date zone in your project:
Specifying which types of exception are displayed in the date zone and bar chart
You can specify which types of exception are displayed in the date zone and bar chart, and which are "folded out" of view. By default in the
To specify which types of exception are displayed in the date zone and bar chart:
- Right-click the date zone and select Properties from the menu that appears. The General tab of the Date Zone Properties dialog appears. A list of the project's exception types are displayed in the Check to fold out of view group.
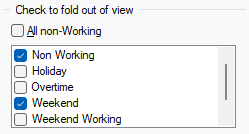
- Select a check box to the left of an exception type to fold it out of view, or clear a check box to display it. Try this now: clear the check box to the left of Weekend and click Apply. Weekend days are now displayed in the date zone and bar chart:
Select the check box to the left of Weekend and click Apply. Weekend days are once again folded out of view.
Configuring unit numbering in the date zone to start at a different date
Week 1 in the date zone defaults to the project's start date. You can configure the unit numbering in the date zone to start on a different date by setting a different "date zero". To do this:
- Click the Dates/Scales tab of the Date Zone Properties dialog.
- Click the
 dropdown in the Date zero field and select a different date from the calendar that appears:
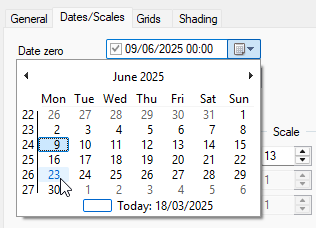
- Click Apply. Note that the Elapsed Unit line now starts numbering from the new date you have selected.
Displaying different grid lines in the bar chart
By default, grid lines are displayed to show the start of each year, month and week. You can display additional grid lines in the bar chart. For example, you may want to display a grid line at a date of your choice, or at a variable date such as "today's date".
To display a grid line that appears on today's date:
- Click the Grids tab of the Date Zone Properties dialog. This tab displays a grid with one row for each grid line that is displayed in the bar chart:
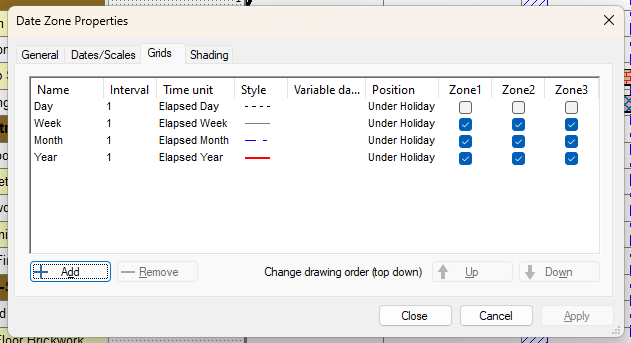
- Click Add. A new row appears in the grid.
- Click in the Name column and enter "Today".
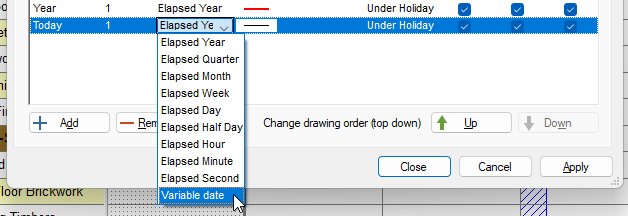
- Click the drop-down in the Time Unit column and select "Variable date":
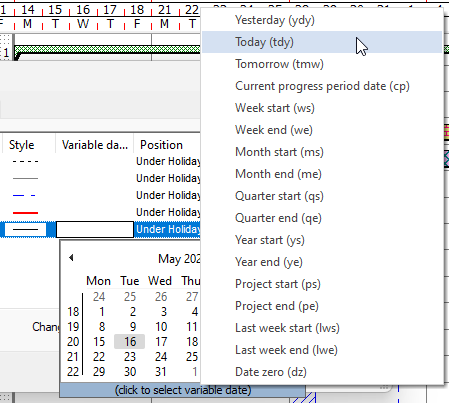
- Click the dropdown in the Variable date column. A calendar appears. Click "click to select variable date" at the bottom of the calendar then select Today (tdy) from the menu that appears:
- Click in the Style column and specify the appearance of the line.
- Click Apply. The new line appears on today's date in the bar chart.
Shading the bar chart between two dates
You can shade the bar chart between two dates. You may want to do this to highlight an important time period - for example, a period of bad weather that has affected a project.
To shade the bar chart between two dates:
- Click the Shading tab of the Date Zone Properties dialog. This tab displays a grid with one row for each area of bar chart shading (at present there are none).
- Click Add. A new row appears in the grid.
- Click in the Start and Finish columns and specify the start and finish dates for the area of shading.
- Click in the remaining columns and specify the appearance of the area of shading.
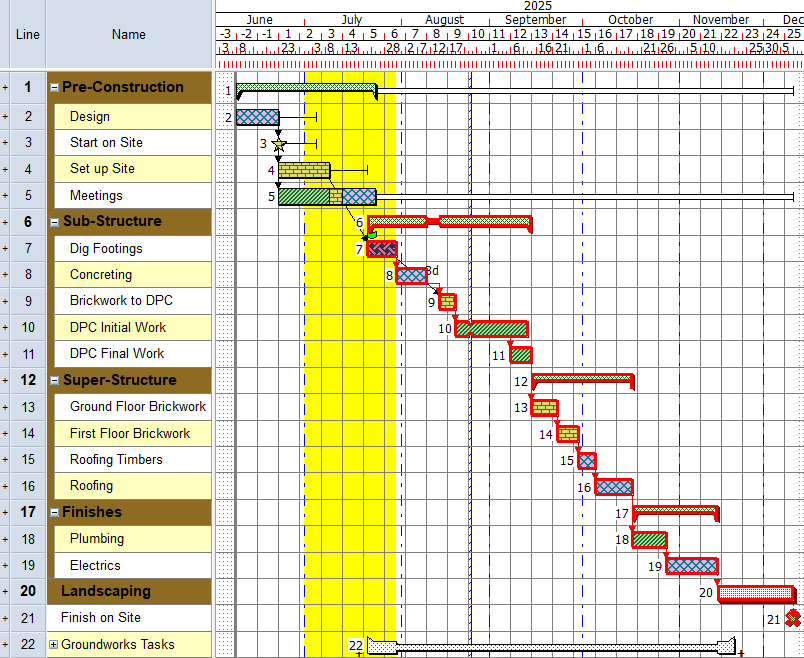
- Click Close. The bar chart is shaded between the two dates that you specified.
Your project should now look something like this (note that the dates and durations of tasks, and the appearance of codes, may be different):
| Previous | Next |
| Formatting the bar chart |