Configuring the spreadsheet
You use the spreadsheet to view and edit information about a project in tabular form. Each spreadsheet row displays information about the tasks or allocations on a bar; each column displays a particular type of information, known as a "field". You can specify which fields are displayed in the spreadsheet by adding columns to the spreadsheet, removing columns from the spreadsheet and configuring the information that is displayed in each column.
You can save the current spreadsheet layout as a "table"
Adding new columns to the spreadsheet
To add a new column to the spreadsheet:
- Right-click the heading of the Start column and select Add Column from the menu that appears. A submenu of field categories appears:
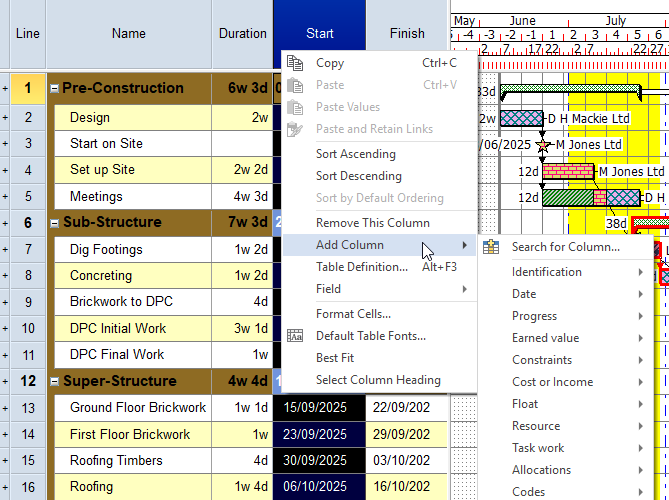
- Click the Identification submenu, then click Notes. A new column is added to the spreadsheet to the left of the Start column and the Table Definition Properties dialog appears. You can use this dialog to configure the way in which fields appear; for now, click Close to close the dialog and view the new column:
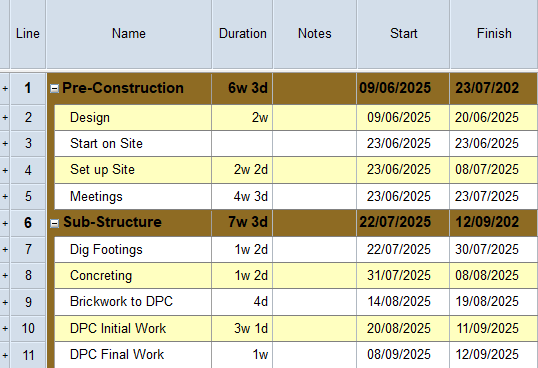
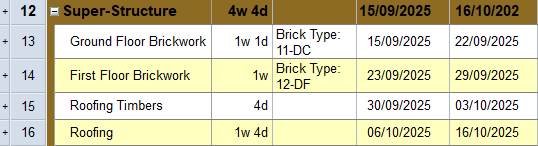
Depending on the width of your spreadsheet, the Finish column may have disappeared from the right of it. If it has, you can click and drag the divider between the spreadsheet and the bar chart to increase the spreadsheet's width and view all of its columns. - Each field has a different use. You can use the Notes column to record textual notes about each task. Click in the column and enter some notes about one or two tasks in the Super-Structure summary group:
In the bar chart, look at the tasks against which you entered notes. You will see that they are now overlaid with a small yellow diamond shape. This indicates that notes have been entered against these tasks:
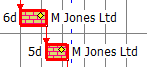
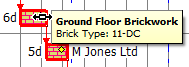
If you position the mouse pointer over one of the yellow diamonds, the task's notes are displayed in a popup in the bar chart:
Changing the field that is displayed in a column
To change the field that is displayed in the Notes column:
- Right-click the heading of the Notes column in the spreadsheet and select Field from the menu that appears.
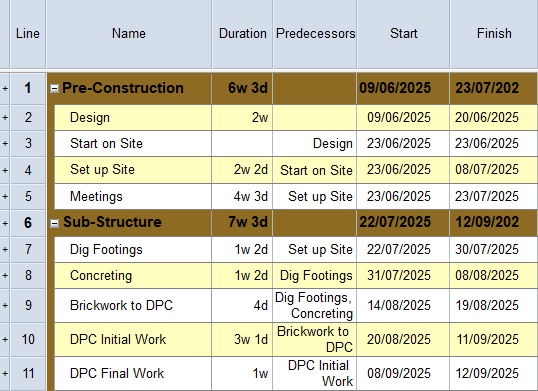
- Click the Logic submenu, then click Predecessors. The Notes column changes to display the Predecessors field, which displays the names of any tasks that are predecessors of the tasks on a bar - ie tasks with outgoing links that finish on one of the tasks on the bar:
Changing the order of columns in the spreadsheet
To change the order in which the Predecessors column appears in the spreadsheet:
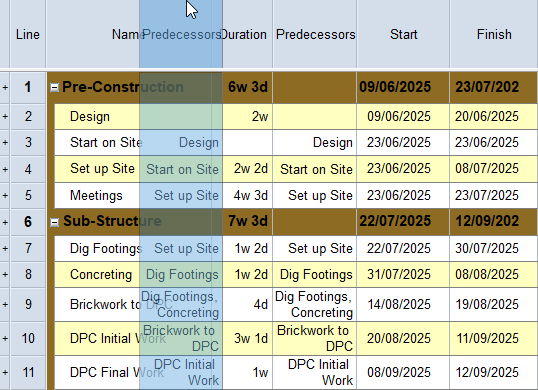
- Position the mouse pointer over the heading of the Predecessors column until the cursor appears like this:

- Click and drag the Predecessors column until it appears midway between the Name and Duration columns:
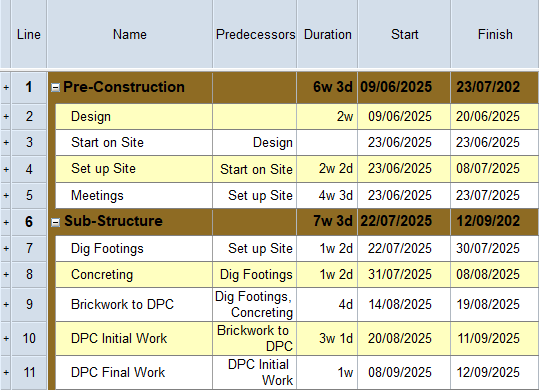
- Release the mouse button. The Predecessors column now appears between the Name and Duration columns:
Deleting columns from the spreadsheet
To delete the Predecessors column from the spreadsheet, right-click the heading of the column in the spreadsheet and select Remove This Column:
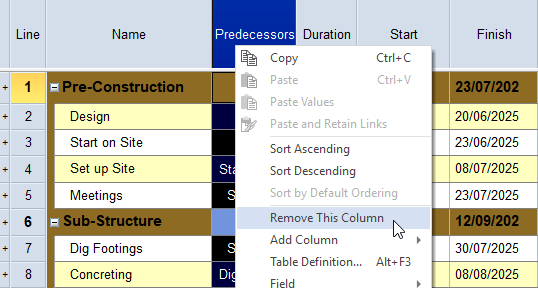
The column is deleted from the spreadsheet.
Saving the current spreadsheet layout as a table
To save the current spreadsheet layout as a table:
- On the View tab, in the View Data group, click the Table dropdown and click Save As. The Save Table dialog appears:
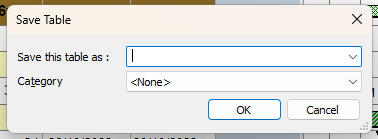
- Enter a descriptive name to apply to the table in the Save this table as field.
- Select a suitable category in which to save the table in the Category field. Categorising tables makes it easier to locate the table you want in a project that contains a large number of different tables.
- Click OK. The current spreadsheet layout is saved as a table. You can now apply this table to any view, as described below.
Applying a different table to the current view
To apply a different table to the spreadsheet, on the View tab, in the View Data group, click the Table dropdown and select a different table from the
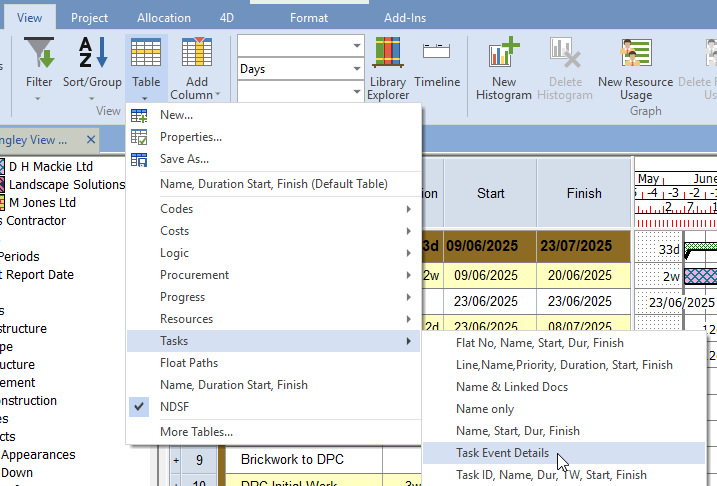
The spreadsheet is updated to display the newly-selected table.
Before you continue, reapply the
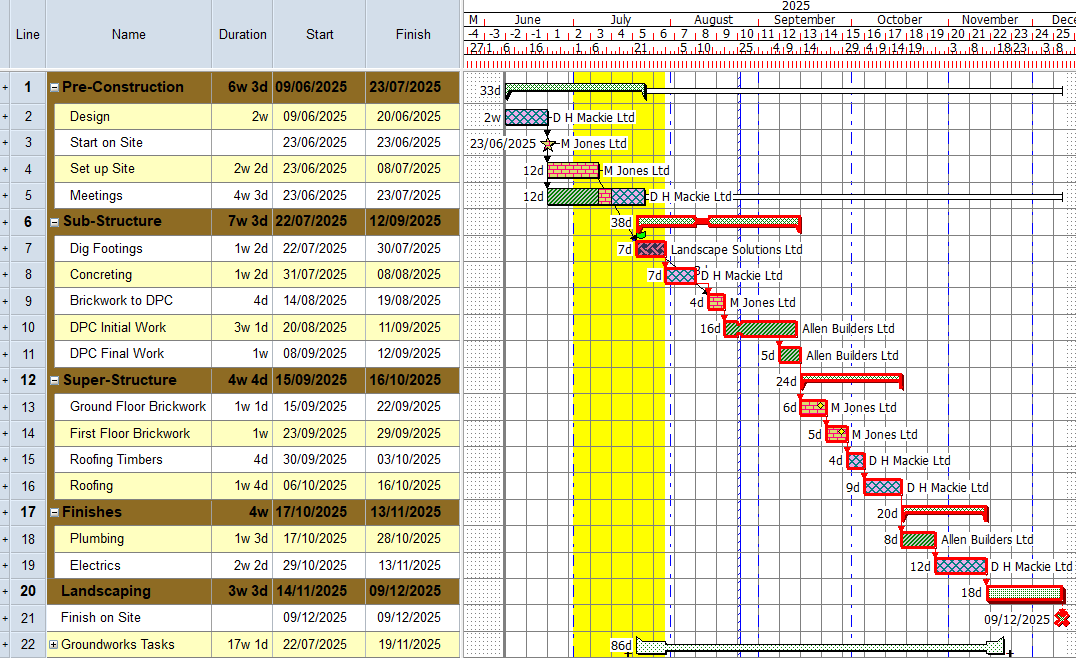
Your project should now look something like this (note that the dates and durations of tasks, and the appearance of codes, may be different):
| Previous | Next |
| Formatting the bar chart | Annotating tasks in a project |