Drawing tasks in one-task-per-line mode
You can display bars in one-task-per-line mode, where each task on the bar is displayed on a separate bar line. You turn one-task-per-line mode on and off for a bar by clicking the + or - symbol in the left-most column of the spreadsheet.
When a bar is displayed in one-task-per-line mode, you can add more tasks to the bar by drawing tasks on any of its lines. For example, you could draw a second task on bar 4 below:
A new task is inserted on a separate line between the two tasks that come before and after the new task. For example, the second task that you drew on bar 4 is placed on its own bar line:
If you draw a task in a position where it will overlap any existing tasks on the same bar, the existing tasks are moved by the minimum amount necessary to accommodate the new task:
For example, if you draw a task on bar 3 as shown above, the task on bar 5 moves aside to make room for the new task as shown below:
In addition to clicking a bar's + or - symbol, you can switch one-task-per-line mode on and off by right-clicking a bar in the Line column of the spreadsheet then selecting One Task Per Line. This command is checked when the selected bar is displayed as one task per line.
You can display all the bars in the view in one-task-per-line mode by selecting the Task Per Line Mode check box on the General tab of the Format Bar Chart dialog. Clicking the + or - symbol of a bar overrides the global setting for the view.
Note that if you configure a bar to allow the tasks on it to overlap, displaying the bar in one-task-per-line mode is a good way of expanding the view of the overlapping tasks. You may find it easier to edit overlapping tasks when the bar on which they are located is viewed in one-task-per-line mode.
Implied links
If a bar on which tasks cannot overlap contains two adjacent tasks that are not linked, the relationship between them can be defined by an "implied link". Details of implied links - which do not actually exist - appear in some areas of the user interface, for example, when tracing link logic using the Links tab of the properties view, to enable you to visualise the relationships between tasks on the same bar in the same way that you can visualise the relationships that are defined by actual links.
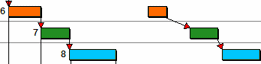
Three implied links exist in the following illustration - one between the orange tasks, one between the green tasks and one between the blue tasks - even though they are not visible:
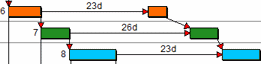
If actual links were added between these tasks, they would look like this:
Creating tasks in the bar chart
Working in one-task-per-line mode
Specifying that tasks on a bar can overlap