Understanding the results of rescheduling
After rescheduling, your bar chart may look quite different. Some tasks may be delayed, and tasks may have one of several appearances: critical, free float, total float or negative float.
Tasks set to start as soon as possible (ASAP) appear at the earliest date they can without affecting any other activity; tasks set to start as late as possible (ALAP) appear at the latest dates possible without affecting any other activity. Where there is more than one task on a bar, the tasks are arranged so that there is no overlapping.
As an aid to understanding the results of rescheduling, you can produce a reschedule report that details the results of the reschedule and any errors and anomalies that have come about as a result of it.
Float, or 'slack', is calculated during a reschedule. It indicates the amount of time by which a task can be delayed without delaying other tasks or the project finish date. Tasks with float give you some room for manoeuvre because they can act as a buffer, protecting the overall project plan from any errors that were made in the original task duration estimates. It is risky to plan a project without any float.
There are two types of float:
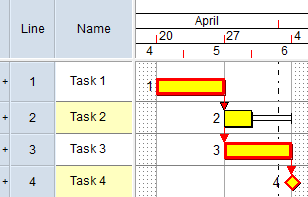
- Free float - the period by which a task can be delayed or extended without affecting any other tasks, or the completion of the project. The free float of a task is the difference between the task's early finish date and the early start date of that task's earliest successor.
![]()
- Total float - the period by which a task can be delayed or extended without delaying the completion of the project. The total float of a task is the difference between the task's early finish date and its late finish date.
![]()
Tasks may also have negative float after a reschedule. Negative float indicates that time must be saved to prevent other tasks from being delayed.
Tasks without float are critical; if a critical task is delayed, it will delay the project finish date.
You should monitor critical tasks carefully to ensure that they are completed on schedule. Critical tasks are marked on screen by default with a thick red border so that you can see them clearly. A link that determines a critical task's position is also marked in red.
You can change the colour that is used to highlight the critical path:
- To change the colour that is used to highlight critical tasks, use the Critical Style field, on the Code Library Properties dialog.
- To change the colour that is used to highlight critical links, edit the appearance of the 'Critical' link category in Library Explorer.
When a sequence of critical tasks spans the project from start to finish, it is known as the critical path. If you want to reduce the project duration, you will need to shorten the critical path.
A project can have more than one critical path; secondary critical paths can arise if you force a task to be critical or if you set a task to start ALAP and this results in the task becoming critical.
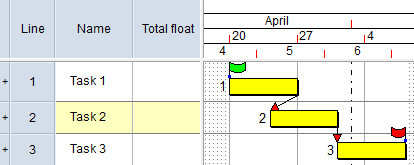
In the following illustration, the critical path is marked in red; all tasks apart from Task 2 are critical, as Task 2 has float:
Tasks with negative float, indicating that time must be saved to prevent other tasks from being delayed, are said to be super-critical.
As an alternative to displaying tasks without float as critical in the bar chart, you can configure Asta Powerproject to display tasks that are located on the longest path through the project network as critical in the bar chart. You do this by selecting the On longest path radio button on the Schedule tab of the Format Bar Chart dialog.
Some tasks might have negative float after a reschedule. Negative float indicates the amount of time that must be saved to prevent other tasks from being delayed.
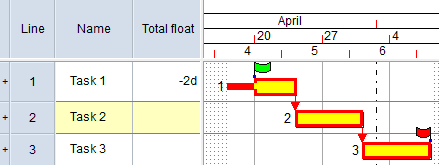
In the following illustration, the conflicting constraints on Start On constraint on Task 1 and the Finish On constraint on Task 3 mean that there is not enough time for all three tasks to be completed:
Following a reschedule, these conflicting constraints cause Task 1 to have negative float, which represents time that must be caught up. A task with negative float is said to be super-critical:
After the reschedule the first task has negative float, which represents time that must be caught up. Note that in this example, all three tasks become critical. A task with negative float is said to be super-critical.
If you prefer negative float to be applied to all of the tasks in a chain rather than just to the first task, you can achieve this by selecting the Negative float applies to chain reschedule option. If you select this option, the constraint at the end of the chain of tasks is not respected, resulting in the final task in the chain exceeding the constraint.
It can be useful to monitor the erosion of total float, as this enables you to take preventative action before the planned finish date of a project is delayed. One way of doing this is by using "logical paths" to analyse paths of tasks that are not critical, but that may become critical if predecessor activities are delayed, or take longer than planned. Asta Powerproject identifies the various logical paths in a project when you reschedule it.
Producing and viewing reschedule reports
Using logical paths to monitor the erosion of total float