Introduction to the Asta Powerproject screen
The main areas of the
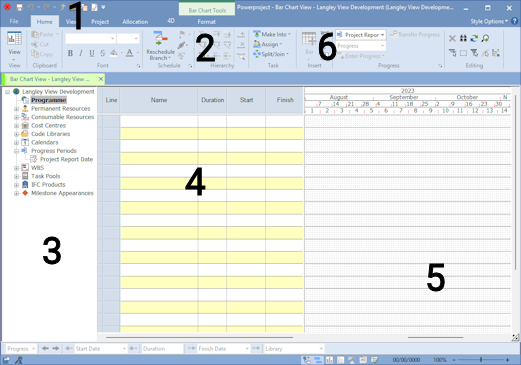
| Screen area | Description | |
|---|---|---|
| 1 | Quick access toolbar | You use the Quick Access toolbar to access a number of commonly-used commands. |
| 2 | Ribbon | You use the Ribbon to access the commands that you need as you work with your projects. The commands are organised in logical groups, which are collected together under tabs. Each tab relates to a type of activity, such as displaying different items in a view or working with allocations. |
| 3 | Project view | You use the project view to navigate around the structure of a project and to drag and drop library items onto bars, tasks and allocations. |
| 4 | Spreadsheet | You use the spreadsheet to view and edit information about a project in tabular form. You can specify which information is displayed in the spreadsheet. |
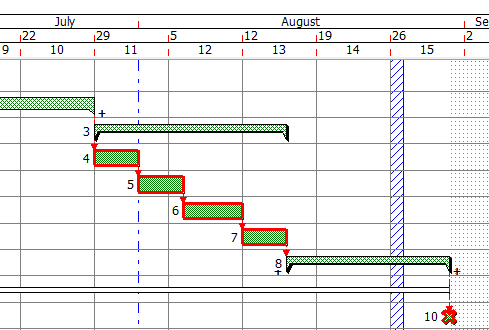
| 5 | Bar chart | You use the bar chart - a Gantt chart - to view a project in graphical form and to draw tasks and links in a project. |
| 6 | Date zone | The date zone illustrates the time span of a project. You can specify which time units - days, weeks, months, etc - are displayed in the date zone. |
| 7 | Object Edit toolbar | You use the Object Edit toolbar to edit the currently-selected bar or task. |
Adjusting the width of the project view, spreadsheet and bar chart
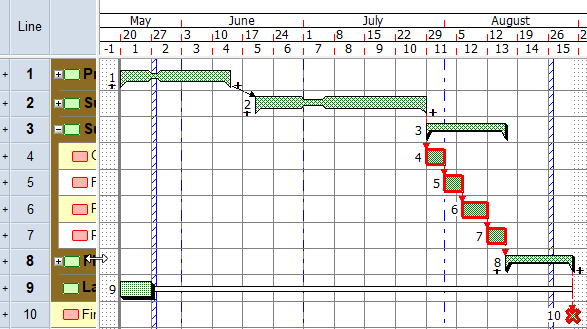
You can adjust the width of the project view, spreadsheet and bar chart by positioning the mouse pointer over the dividing lines that appear between them until the pointer appears like this -  - then clicking and dragging to the left or right. This can be useful if, for example, you want to view more of the bar chart at the expense of the spreadsheet display:
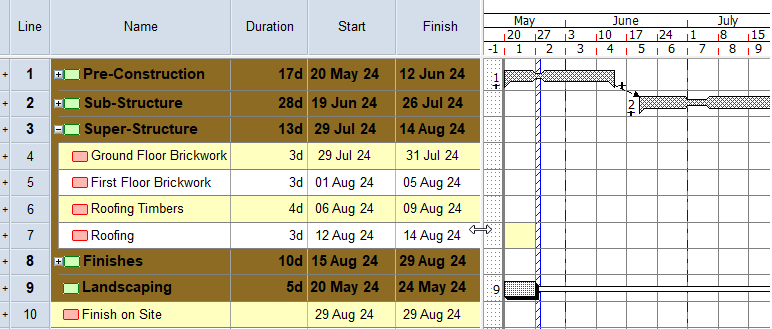
Or if you want to view more of the spreadsheet at the expense of the bar chart display:
Adjusting the scale of the project using the date zone
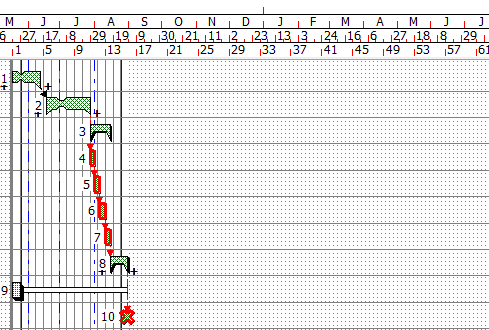
You can adjust the amount of time that is displayed in the bar chart by adjusting the scale of the project using the date zone.
To adjust the scale of the project, position the mouse pointer over one of the red vertical lines in the date zone until the pointer appears like this - - then click and drag to the left or right.
If you drag to the left, the bar chart displays a larger time period and tasks appear smaller:
If you drag to the right, the bar chart displays a smaller time period and tasks appear larger:
| Previous | Next |
| Creating a new project | Configuring a project's calendars |