Format Bar Chart dialog - Tasks tab
You use the Tasks tab of the
Format Bar Chart dialog to specify the way in which tasks are displayed on the bar chart. You can specify whether to display tasks using the appearance of the code libraries that have been assigned to them, using the appearance of the resources that have been assigned to them
Note that if the current view is displayed in 'jagged progress' mode, the fields on this tab apply to the tasks from the current baseline - or from individual project baselines if 'jagged progress' mode is configured to show progress on them - rather than the live tasks.
To access the Format Bar Chart dialog, on the Format tab, in the Format group, click Format Bar Chart.
| Field/Button | Description |
|---|---|
| Use default |
Click this radio button to specify that you want to display tasks using
If you click this radio button, you must then click the Change Appearances button to set a different default appearance for each type of task |
| Codes on bars |
Click this radio button to use the codes that have been assigned to bars to colour tasks. All the tasks on a bar will be displayed with the same appearance if a code has been assigned to the bar.
If you click this radio button, click the Display button to display the Multiple Display Libraries dialog, which you can use to specify which code libraries to use to colour tasks on the bar chart. |
| Codes on tasks |
Click this radio button to use the codes that have been assigned to tasks to colour tasks. If a bar has more than one task, each task takes the appearance of a code that has been assigned to it, which can result in the tasks on the bar being having different appearances.
If you click this radio button, click the Display button to display the Multiple Display Libraries dialog, which you can use to specify which code libraries to use to colour tasks on the bar chart. |
| Consumable resources |
Click this radio button to use the consumable resources that have been assigned to tasks to colour tasks. Each task takes the appearance of a consumable resource that has been assigned to it.
If you click this radio button, click the Display button to display the Multiple Display Resources dialog, which you can use to specify which consumable resources to use to colour tasks on the bar chart. |
| Permanent resources |
Click this radio button to use the permanent resources that have been assigned to tasks to colour tasks. Each task takes the appearance of a permanent resource that has been assigned to it.
If you click this radio button, click the Display button to display the Multiple Display Resources dialog, which you can use to specify which permanent resources to use to colour tasks on the bar chart. |
| Display |
If you have clicked either Use on bars or Use on tasks, click this button to display the Multiple Display Libraries dialog, which you can use to specify which code libraries to use to colour tasks on the bar chart. You can use more than one code library at a time to colour tasks. Tasks are coloured according to the codes from the selected libraries that have been assigned to them - or, in the case of the bar chart, to their bars, depending on whether you have clicked the Codes on tasks or Codes on bars radio button.
If you have clicked either Consumable resources or Permanent resources, click this button to display the Multiple Display Resources dialog, which you can use to specify which resources to use to colour tasks on the bar chart. You can use any number of resource folders and individual resources to colour tasks. Tasks are coloured according to the selected resources that have been assigned to them.
Specifying which code libraries to display
Colour-coding tasks using the appearance of their assigned resources |
| Left data display |
To display a spreadsheet field to the left of the first task on each bar, select the field you want to display. You can configure the information that some fields display by specifying parameters. For example, if you choose to display certain cost-related fields, you can select a specific cost centre and a specific range of dates. If the field that you select supports parameters, the  button to the right becomes enabled. Click this button to access the Attributes dialog, in which you can specify the parameters. button to the right becomes enabled. Click this button to access the Attributes dialog, in which you can specify the parameters.
|
| Right data display |
To display a spreadsheet field to the right of the last task on each bar, select the field you want to display. You can configure the information that some fields display by specifying parameters. For example, if you choose to display certain cost-related fields, you can select a specific cost centre and a specific range of dates. If the field that you select supports parameters, the button to the right becomes enabled. Click this button to access the Attributes dialog, in which you can specify the parameters. |
| Task data display |
To display a spreadsheet field over the top of each task, select the field you want to display. You can configure the information that some fields display by specifying parameters. For example, if you choose to display certain cost-related fields, you can select a specific cost centre and a specific range of dates. If the field that you select supports parameters, the button to the right becomes enabled. Click this button to access the Attributes dialog, in which you can specify the parameters. |
| Opaque background | If you are displaying spreadsheet fields in the bar chart, select this check box to apply a white background to the information, or clear the check box to apply a transparent background. |
| Change Font | Click this button to select the font in which to display the spreadsheet fields that you are displaying on the bar chart. |
| Show dates instead of durations for milestones |
If you use one of the Task data display fields to display a duration field in the bar chart, you can choose to display the date of each milestone instead of its duration. As every milestone has a duration of zero, you may find it useful to display the date of each milestone rather than its duration.
Select this check box to display the date, rather than the duration, of each milestone when a duration field is displayed in the bar chart, or clear the check box to display the duration of each milestone - which is always zero. |
| Show task notes |
Select this check box to display task notes in popups in the bar chart when the mouse pointer hovers over a task, or clear the check box to hide task note popups.
If you choose to display task notes in the bar chart, a yellow diamond appears on those tasks against which notes have been entered. Hover the mouse pointer over a task to display its notes.
|
| Change Font | Click this button to change the font in which task notes are displayed. |
| Settings |
Click this button to display the Overlapping Tasks and Milestone Rows Settings dialog, which you can use to specify the way in which tasks appear on bars that have been configured to allow overlapping tasks.
|
| Change Appearances | Click this button to display the Format Task Appearances dialog, which you can use to specify a different default appearance for each type of task - standard tasks, summary tasks, milestones, etc. The default appearances that you specify are used only when the Use default radio button is clicked. |
How do I...
- Click the Use default radio button.
- Click the Change Appearances button. The Format Task Appearances dialog appears.
- Use the colour and pattern fields on the dialog to specify the appearance of each type of task.
- Click OK to return to the Format Bar Chart dialog.
- Click Apply.
- Click the Codes on bars radio button.
- Click Display. The Multiple Display Libraries dialog appears.
- Select the code libraries that you want to use to colour tasks by adding them to the Show libraries in this order field.
- Determine the order in which code libraries are used to colour tasks by moving the code libraries up or down in the list in the Show libraries in this order field.
Code libraries at the top of the list take priority over those lower down the list. If a bar is assigned a code from more than one display library, the appearance of the tasks on the bar is taken from the library that appears nearest the top of this list. - Click OK to return to the Format Bar Chart dialog.
- Click Apply.
- Click the Codes on tasks radio button.
- Click Display. The Multiple Display Libraries dialog appears.
- Select the code libraries that you want to use to colour tasks by adding them to the Show libraries in this order field.
- Determine the order in which code libraries are used to colour tasks by moving the code libraries up or down in the list in the Show libraries in this order field.
Code libraries at the top of the list take priority over those lower down the list. If a task is assigned a code from more than one display library, its appearance is taken from the library that appears nearest the top of this list. - Click OK to return to the Format Bar Chart dialog.
- Click Apply.
- Click either the Consumable resources radio button or the Permanent resources radio button, depending on whether you want to colour tasks according to their consumable resources or their permanent resources.
- Click Display. The Multiple Display Resources dialog appears.
- In the Available resources field, select the individual resources and resource folders that you want to use to colour tasks by selecting the check box to their left. Each selected resource and resource folder appears in the Show resources in this order field.
- Determine the order in which resources are used to colour tasks by moving the resources and resource folders up or down in the list in the Show resources in this order field.
Resources at the top of the list take priority over those lower down the list. If a task is assigned more than one of the selected resources or resource folders, its appearance is taken from the resource or resource folder that appears nearest the top of this list. - Click OK to return to the Format Bar Chart dialog.
- Click Apply.
- Click the Use default radio button.
- Click the Change Appearances button. The Format Task Appearances dialog appears.
- Select the Determine task appearance from lead resource assignment check box.
- Use the colour and pattern fields on the dialog to specify the appearance of each type of task (to be applied to any tasks that do not have a lead resource assigned).
- Click OK to return to the Format Bar Chart dialog.
- Click Apply.
In order for this type of colouring to take effect, you must specify that one - and only one - resource or cost centre assignment against each task is the "lead resource", by selecting the Lead resource check box on the Details tab of the allocation's properties dialog. If you expect that a resource or cost centre will usually be considered to be the "lead resource" when it is assigned to tasks, select the Lead resource check box on the resource or cost centre's properties dialog to specify that the Lead resource check box should be selected by default for allocations of the resource or cost centre.
You can display spreadsheet fields to the left of the first task on each bar, to the right of the last task on each bar, and over each individual task. This enables you to display, for example, each task's WBS code on top of each task, and each bar's finish date to the right of the last task on each bar.
Select the fields you want to display in the bar chart, and the position in which to display them, in the Task data display group.
You can configure the information that some fields display by specifying parameters. For example, if you choose to display certain cost-related fields, you can select a specific cost centre and a specific range of dates. If the field that you select supports parameters, the button to the right becomes enabled. Click this button to access the Attributes dialog, in which you can specify the parameters.
Click Change Font to specify the font in which to display the information and use the Opaque background check box to specify whether you want the information to appear with a transparent or white background.
The font settings you specify here are also applied to the lead/lag annotations that appear next to links with lead/lag time.
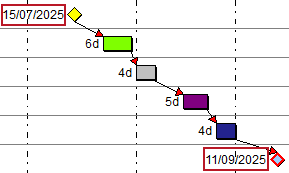
If you display a duration field in the bar chart, you can choose to display the date of each milestone instead of its duration, using the Show dates instead of durations check box. If you select this check box, the date, rather than the duration, of each milestone is displayed when a duration field is displayed in the bar chart:
If you clear the check box, the duration of each milestone is displayed. As every milestone has a duration of zero, you may find it useful to select this check box, as the date of a milestone is a more useful piece of information than its duration.
To display task notes in popups in the bar chart, select the Show task notes check box. A preview of how task notes will be displayed is displayed. You can change the way in which they are displayed by clicking the Change Font button and selecting different font settings.
Specifying which code libraries to display
Colour-coding tasks using the appearance of their assigned resources