Understanding the structure and elements of projects
If you want to create your own Business Intelligence export models, you must understand the structure of Powerproject projects and the elements that make up a project.
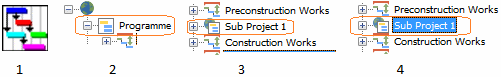
The term "project" can refer to one of four different things:
- A project file - a *.PP file, for example.
- A discrete project within an Powerproject Enterprise programme.
- A summary task or expanded task that has been marked with an "Is a project" flag.
- A project that contains other summary tasks or expanded tasks that have been marked with an "Is a project" flag.
By default, the entire *.PP file or Enterprise project is exported; however, it is still possible to identify subordinate projects within the exported data.
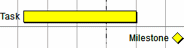
Tasks, or activities, are the basic unit of planning a project. Tasks have a duration. Milestones have no duration; a milestone represents an event as a single point in time.
Tasks have properties. Allocations of various kinds and user-defined fields can be assigned to them. The items that belong to a task or milestone are not hierarchical.
A line in the spreadsheet is known as a bar. A bar can contain multiple tasks. Bars have properties, code library allocations and user-defined fields, the values of which are considered common to all tasks on that bar.

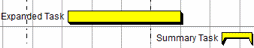
These task types do not represent activities; they represent groupings of activities. Expanded tasks look like normal tasks with a shadow. Their group of tasks is known as a chart.
Summary tasks are thinner than normal tasks, with pointed-down ends. Their group of tasks is known as a summary group.
Expanded tasks and summary tasks can be marked as projects in the project tree. Internally, expanded tasks and summary tasks are the same, but you can configure them to be displayed differently.
Expanded tasks and summary tasks are the children of bars, and they can have child bars of their own. This is a recursive structure which can go down an unlimited number of levels.
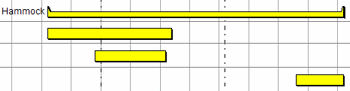
Hammocks are special kind of summary task. They display tasks as if they were their children, but in fact the tasks displayed are duplicates of tasks belonging to other summaries. As a report writer, you should ignore hammocks, as they contain copies of tasks that are included elsewhere in the project hierarchy.
Properties are values that belong to or describe an object. For example, a task has a start date property.
Allocation describes a group of items that cannot be placed freely in the programme but must be added to a task. Allocations cannot be parents of other objects; they can be only children. Allocations have their own properties that describe them.
Allocations are records of library objects - resources or costs - that have been assigned to tasks. The properties of allocations are independent from the associated library object properties, but they are usually closely related.
Costs
Each projects contains one or more cost centres. When you assign a cost centre to a task, a cost allocation is created, which is a record of a cost amount belonging to the assigned cost centre against that task.
Permanent Resources
Permanent resources are used to represent finite items such as people or machinery. When you assign a permanent resource to a task, a permanent resource allocation is created, which is a record of the effort the resource has assigned to that task. Permanent resources have an availability limit which means that you should not allocate more of a particular resource than is available at that point in time.
Consumable Resources
Consumable resources are used to represent unlimited items such as bricks, where you can always get more. When you assign a consumable resource to a task, a consumable resource allocation is created, which is a record of the quantity of the resource that is assigned to that task.
Both permanent and consumable resource allocations can have an associated costs, but it is important to note that the cost is a calculated property of the allocation, not a child cost allocation. This means you will find its value in the Resource Allocations table of an export, rather than in the Cost Allocations table.
Progress periods
When work is marked as being done, a task completed section record is created. This creates an allocation of the current progress period to the task. This is known as a task or allocation completed section.
Code libraries
Code libraries are a sophisticated way of colour-coding tasks. You can allocate an entry from a code library to a task to identify it as belonging to a custom category. Codes are the single most common method of selecting specific activities for reports.
User-defined fields
User-defined fields - also known as user fields - enable you to create custom properties on any object type. User-defined fields are commonly used on task types but less so on library objects, where the information they contain can be awkward to access.
The hierarchy of summary or expanded tasks and tasks is known as the natural order, or the drawn order. It is the default order in which tasks are presented in the bar chart and the one you are most likely to use when writing reports. However, there are other ways of viewing the tasks and their relationships, and it is not uncommon for reports to reference these other types of structure in preference to the natural order.
Unique task ID
This is a sequential or hierarchical numbering system which planners sometimes use to create relationships between tasks. Unique task IDs do not have to be unique within a project, depending on the project's settings.
Work breakdown structure (WBS)
This is a hierarchical coding system used to indicate the relationships between tasks. This is a purely optional system and it cannot be relied upon to capture every task in a project. However, it is not uncommon to be asked to build reports based on which tasks conform to a particular branch or pattern of the WBS structure.
Work breakdown numbering (WBN)
This is an older, simpler, semi-automated numbering scheme. It is similar to the WBS but uses text fields rather than codes, so is less useful within Powerproject. However, it may still be used in a project - especially in older projects.
Links
Links represent logical connections between tasks. In its simplest form a link says the linked-from task should be complete before the linked-to task starts. Link logic is enforced through a manually-triggered process called rescheduling that ensures that the programme follows the link rules, which can be extremely complicated. A task that drives another task via a link is called the predecessor task, and one that is driven is called the successor task.
Critical path
Where tasks are linked together into chains, the reschedule will determine the proper order in which tasks need to be completed. The critical path is a line of linked tasks where any change to those tasks will affect the project finish date. It is quite common for reports to require information about tasks that appear on the critical path. All tasks have a Boolean "critical" flag.
Everything in Powerproject has an object ID - or ID, for short. This is the internal unique identifier and should not be confused with any other user-defined IDs, such as unique task IDs.
Object IDs are not useful from a user perspective, so they are rarely displayed in Powerproject, but they are extremely useful for determining unique identity with respect to relationships. Object IDs are also vital when linking SQL tables.
There is a "Parents" property that does not appear in the OLE. This gives you the complete comma-separated hierarchical lineage of object IDs from an object, back to its most distant parent. This is often useful for restricting reports to the children of specific tasks within the hierarchy.
<Column name="Lineage" datatype="String" group="Identification" field="parents"/>
Some objects support the Order string property, which is a period-separated list path using names rather than IDs.
Note that Microsoft Excel® may display confusing unit-separator commas if the cell format is set to currency or number.
Some reports select tasks according to a project's structure; others select tasks by measures of interest. There are a great many potential measures of interest. The most common are described below. Refer to the Powerproject Help for more information on each of the following
Progress
There are three ways of measuring progress in a project:
- Duration percent complete - a simple percentage of a task's scheduled duration.
- Effort percent complete - a measure of the resource man hours assigned to a task.
- Overall percent complete - this behaves like duration percent complete by default, but can be edited so that the relationship between time and work can be overridden.
Float
Float is the amount of time a task can be delayed before affecting something else. Critical tasks have no float. There are two variation: total float and free float.
Variance
Date variance is the difference in time between when something was originally planned to happen in a baseline and when it is currently scheduled to happen in the live programme. You can calculate a variance on any two measures, but date variances are the most common.
Slip
Slip is the difference between the current report date and the effective progress date. Slip is used on projects that are not rescheduled.
Earned Value Analysis
Earned Value Analysis (EVA) is a statistical process that works out how much of a baseline programme has been achieved to date.
You can access cost earned value statistics in a Business Intelligence export model, provided that you have correctly cost-loaded and progressed your programme. However, very few people do this, as it requires much work. Typically, people use Earned Schedule Analysis which does not require cost-loading your programme; however, it is not practical to use this in a Business Intelligence export model.
Powerproject has a built-in tool called EVA Reporter, which can graph EVA or ESA to Microsoft Excel.
Creating and compiling your own Business Intelligence export models
Finding the names of properties to include in a Business Intelligence export model
Adding columns to Business Intelligence export models
Deleting elements from Business Intelligence export models
Reporting on non task-based information
Identifying the run date and number of each export
Identifying the source project of data objects when data is exported from multiple PP files