Overriding the horizontal and vertical scale of printed output
You can override the default horizontal and vertical scale settings of printed output if required. Specifying a horizontal or vertical scale of your own choosing may be useful if you want to produce a printout with precise layout settings. However, in most circumstances you will obtain the optimum printout with a sensible aspect ratio by using the settings defined in the Format Bar Chart dialog. You use the Scaling tab of the Print dialog to override the horizontal and vertical scales.
Overriding the horizontal scale of printed output
You can either override the horizontal scale using a default horizontal scale, or using your own scale settings, in up to three separate date zone sections that you can define. Defining a different horizontal scale for different date zone sections can be useful. For example, you could create one date zone section for past work, one section for current work and one section for future work. To focus on current work in the printout, you could apply the following scales to each section:
- Section 1 (past work): 2 weeks per centimetre.
- Section 2 (current work): 1 day per centimetre.
- Section 3 (future work): 1 week per centimetre.
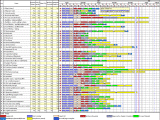
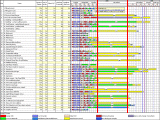
The following illustrations depict a printout that uses a single horizontal scale and one that uses three different horizontal date zone scales (note that the red lines in the second illustration merely highlight the scale boundaries and do not appear on the actual printout):
|
|
|
|
Printed with the default horizontal scale |
Printed with three horizontal date zone scales |
To override the horizontal scale with a default horizontal scale in the printout, select the Automatic radio button against Override horizontal (datezone) scale.
To specify your own horizontal scale settings for the printout:
- Select the Manual radio button against Override horizontal (datezone) scale.
- Click Scale. The Date Zone Scale dialog appears. You can use this dialog to create up to three separate date zone sections and specify a different horizontal scale for each.
- Enter the number of time units you want to display per centimetre, for example 2 weeks per centimetre, in the first row of the dialog. If you want to apply the same horizontal scaling to the entire printout, this is all you need to do.
- If you want to apply different scaling to different sections of the printout, select the 2 check box to create a second date zone section. Enter the date on which you want the new section to start, then specify the number of time units you want to display per centimetre for this section.
- If you want to create a third date zone scale, select the 3 check box and specify its start date and scaling.
- Click OK to close the dialog and return to the Print dialog.
To use the horizontal scale settings as defined in the date zone in the current view, select the Off radio button.
Overriding the vertical scale of printed output
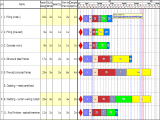
The following illustrations depict a printout that uses the default vertical scale and one that uses a large vertical scale:
|
|
|
|
Printed with the default vertical scale |
Printed with a larger vertical scale |
To specify your own vertical scale settings for the printout:
- Select the Manual radio button against Override vertical (chart) scale.
- Click Scale. The Chart Scale dialog appears. You can use this dialog to specify appropriate bar and gap values for project and baseline bars and allocations.
- Specify the scale with which you want to output the current view using the fields on the screen.
- Click OK to close the dialog and return to the Print dialog
To use the vertical scale settings as defined in the current view, select the Off radio button.
To reset the fields on this tab back to their default settings, click Reset to Default. Note that this button also resets the settings on the Date Zone Scale dialog and the Chart Scale dialog.
Printing tiled or paginated output


