Configuring the project performance dashboard
You can configure the project performance dashboard in a number of different ways, so that it displays the information in which you are interested. The different elements of the dashboard are known as 'widgets'. Each widget displays a different type of project performance information. You can configure the dashboard to display information on more than one page. For example, you may want to set up a number of dashboard pages, with each one displaying a different selection of widgets - one displaying information on activities; one displaying information on project progress; and so on.
You can add the following widgets to the dashboard:
The 'Daily Activities' widget shows a bar chart that displays the total number of tasks that are scheduled to take place each day in the active pull plans of the selected projects:
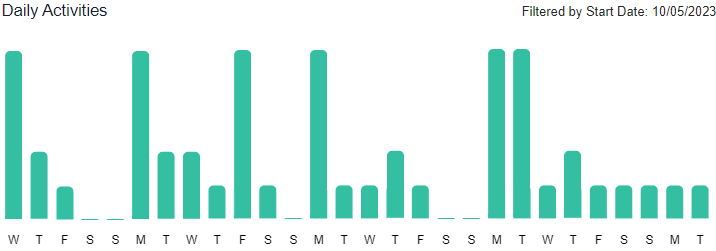
The widget displays a column for each day in the four weeks following on from the start date you specify.
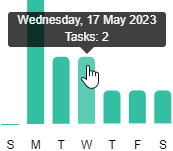
To see the exact number of tasks on a particular day, hover the mouse pointer over a column. The number of tasks on that day is displayed in a popup:
You can configure the Daily Activities widget by:
- Specifying the projects you want it to include. If the dashboard filters are not currently displayed, click Edit Dashboard and select Toggle Filters from the menu that appears, then select the projects you want the widget to include in the Project field. You can select any number of projects - you may want to view the daily activities in a single project, in a number of projects, or in all projects.
- Specifying the start date of the widget. If the dashboard filters are not currently displayed, click Edit Dashboard and select Toggle Filters from the menu that appears, then specify the start date in the Start Date field. To set the start date to the current date, click 'Today', to the right of the Start Date field.
The 'Project Percentage Complete by Active Pull Plan' widget shows a percentage complete figure for the selected projects, based on the percentage of tasks in the active pull plan that are 100% complete. For example, if a project's active pull plan contains 100 tasks, of which 60 are 100% complete, the project will be shown to be 60% complete:

Only tasks that are 100% complete are used to calculate the percentage complete figure for each project: the progress that has been recorded against part-completed tasks is not included.
For an alternative method of illustrating the percentage complete figure of projects, use the Project Percentage Complete by Master Plan widget.
You can configure the Project Percentage Complete by Active Pull Plan widget by specifying the projects you want it to include. If the dashboard filters are not currently displayed, click Edit Dashboard and select Toggle Filters from the menu that appears, then select the projects you want the widget to include in the Project field. You can select any number of projects - you may want to view the percentage complete figure for a single project, for a number of projects, or for all projects.
The 'Project Percentage Complete by Master Plan' widget shows a percentage complete figure for the selected projects, based on the percentage progress that has been recorded against the master plan's activities:

For an alternative method of illustrating the percentage complete figure of projects, use the Project Percentage Complete by Active Pull Plan widget.
You can configure the Project Percentage Complete by Master Plan widget by specifying the projects you want it to include. If the dashboard filters are not currently displayed, click Edit Dashboard and select Toggle Filters from the menu that appears, then select the projects you want the widget to include in the Project field. You can select any number of projects - you may want to view the percentage complete figure for a single project, for a number of projects, or for all projects.
The 'Work Complete by Project Team' widget shows a graphical indication of the number of tasks that have been completed by each project team for the selected projects:
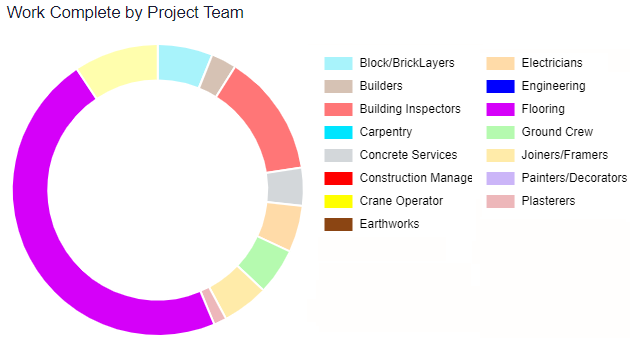
Use this widget to view an indication of which project teams have completed the most - and least - of their work on the selected projects.
Each segment represents the number of completed whiteboard tasks as a percentage of all of a project team's tasks. For example, if a Bricklayers project team has twenty tasks across the active pull plans of three projects, with five of them are marked as complete, the percentage for the Bricklayers project team will be 25%.
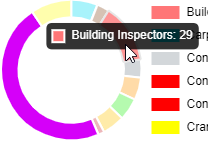
Hover the mouse pointer over a segment to view the work complete percentage value for that project team in a tooltip:
You can configure the Work Complete by Project Team widget by specifying the projects you want it to include. If the dashboard filters are not currently displayed, click Edit Dashboard and select Toggle Filters from the menu that appears, then select the projects you want the widget to include in the Project field. You can select any number of projects - you may want to view the work complete indication for a single project, for a number of projects, or for all projects.
The 'Work by Project Team' widget shows a table displaying the amount of work that has been planned and completed by each project team for the selected projects:
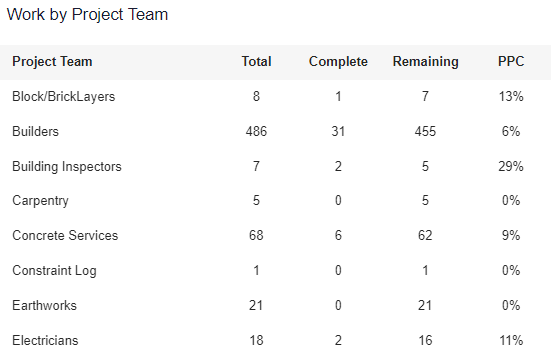
The widget displays the following information for each project team:
- Total - the total number of pull plan tasks assigned to the project team.
- Complete - the number of these pull plan tasks that are 100% complete.
- Remaining - the number of these pull plan tasks that are not yet 100% complete.
- PPC - the percentage of the project team's pull plan tasks that are 100% complete.
You can configure the Work by Project Team widget by specifying the projects you want it to include. If the dashboard filters are not currently displayed, click Edit Dashboard and select Toggle Filters from the menu that appears, then select the projects you want the widget to include in the Project field. You can select any number of projects - you may want to view the work values for a single project, for a number of projects, or for all projects.
To add a widget to the dashboard:
- If your dashboard comprises more than one page, click the page to which you want to add a widget.
- Click Edit Dashboard and select Add Widget from the menu that appears. The Add Widget dialog appears.
- Select the widget you want to add to the dashboard in the field on the dialog, then click Save.
The widget is added to the dashboard. You can now resize it or change its position as required.
You can resize widgets in the dashboard to make them larger or smaller. You may want to resize a widget to make it smaller so that you can fit another widget onto the dashboard alongside it.
To resize a widget in the dashboard:
- If your dashboard comprises more than one page, click the page containing the widget you want to resize.
- Click Edit Dashboard and select Toggle Layout from the menu that appears. The dashboard is displayed in Layout mode, in which you can resize widgets, move them around the dashboard and remove them from the dashboard.
- Position the mouse pointer over an edge of the widget until it takes on one of the following appearances:

- Holding down the left mouse button, click and drag the mouse pointer to resize the widget. The widget changes size as you drag.
- When you are happy with the size of the widget, release the mouse button.
- When you have finished configuring the layout of the dashboard, click Edit Dashboard and select Toggle Layout again to turn off Layout mode.
To change the position of a widget in the dashboard:
- If your dashboard comprises more than one page, click the page containing the widget you want to move.
- Click Edit Dashboard and select Toggle Layout from the menu that appears. The dashboard is displayed in Layout mode, in which you can resize widgets, move them around the dashboard and remove them from the dashboard.
- Position the mouse pointer over the centre of the widget.
- Click and hold down the left mouse button. The mouse pointer takes on the following appearance:

- Holding down the left mouse button, click and drag the mouse pointer to move the widget.
- When you are happy with the position of the widget, release the mouse button.
- When you have finished configuring the layout of the dashboard, click Edit Dashboard and select Toggle Layout again to turn off Layout mode.
You can use filters to specify the data that is displayed in the dashboard widgets. There are two dashboard filters available:
- Project: use this filter to specify the start date of the data displayed in the dashboard widgets. You can select any date, or click 'Today' to set the filter to the current date.
- Start Date: use this filter to specify the projects you want to include in the dashboard widgets. You can select any number of projects - you may want to view information on a single project, on a number of projects, or on all projects.
If your dashboard comprises more than one page, your filter settings apply only to the current dashboard page.
You can display the filters at the top of the dashboard. To do this, click Edit Dashboard and select Toggle Filters from the menu that appears. The filters that are available depend on the widgets that are displayed in the current dashboard page: if the page includes no widgets for which a filter can be used, the filter does not appear. Your filter selections are applied automatically to the dashboard widgets.
To hide the filters from the top of the dashboard, click Edit Dashboard and select Toggle Filters again.
To remove a widget from the dashboard:
- If your dashboard comprises more than one page, click the dashboard page that contains the widget you want to remove.
- Click Edit Dashboard and select Toggle Layout from the menu that appears. The dashboard is displayed in Layout mode, in which you can resize widgets, move them around the dashboard and remove them from the dashboard.
- Click
 at the top-right of the widget. A popup appears, asking if you are sure that you want to remove the widget from the dashboard page.
 - Click Yes. The widget is removed from the dashboard page.
- When you have finished configuring the layout of the dashboard, click Edit Dashboard and select Toggle Layout again to turn off Layout mode.
You can configure the dashboard to display information on more than one page. For example, you may want to set up a number of dashboard pages, with each one displaying a different selection of widgets - one displaying information on activities; one displaying information on project progress; and so on.
To add a page to the dashboard:
- Click Edit Dashboard and select Add Page from the menu that appears. The Add Page dialog appears.
- Enter a name to apply to the page in the New Page Name field, then click Save.
The page is added to the dashboard. A tab with the name you entered appears at the top of the Dashboard page, allowing access to the new page:

You can now add widgets to the new page as required.
To rename a dashboard page:
- Click the dashboard page that you want to rename.
- Click Edit Dashboard and select Rename Page. The Rename Page dialog appears.
- Enter a new name to apply to the page in the New Page Name field, then click Save.
To remove a page from the dashboard:
- Click the dashboard page that you want to remove.
- Click Edit Dashboard and select Delete Page. A popup appears, asking if you are sure that you want to delete the dashboard page.
- Click Yes. The page is removed from the dashboard.